
Inner Enum Class:
| Class name | Description |
|---|---|
| chart.TYPE | Chart type enumeration, used to specify how the chart is displayed: - NONE: no chart - LINE: line chart - BAR: bar chart - SCATTER: scatter chart |
| chart.UPDATE_MODE | Data update mode enumeration, controls how data is displayed when new data is added: - SHIFT: data shifts left (new data is added on the right, old data shifts left) - CIRCULAR: circular overwrite (new data overwrites the oldest data) |
| chart.AXIS | Axis enumeration, specifies the axis the data is bound to: - PRIMARY_Y: primary Y axis (default) - SECONDARY_Y: secondary Y axis - PRIMARY_X: primary X axis - SECONDARY_X: secondary X axis - LAST: last axis |
Core Methodology:
| Method name | Meaning | Input parameters (actually usable format) | Return value | Notes |
|---|---|---|---|---|
| __init__(parent) | Chart constructor, creates a chart instance | parent: lv.obj type (e.g. the screen object scr) | lv.chart object | None |
| set_type(type) | Sets the chart display type | type: int enum value (1=LINE line chart, 2=BAR bar chart, 3=SCATTER scatter chart, 0=NONE) | None | lv.chart.TYPE.LINE actually corresponds to the int value 1; just pass an int directly |
| set_point_count(count) | Sets the maximum number of data points the chart displays | count: int type (e.g. 10/20) | None | None |
| set_update_mode(mode) | Sets the update logic when new data is added | mode: int enum value (0=SHIFT shift left, 1=CIRCULAR circular overwrite) | None | lv.chart.UPDATE_MODE.SHIFT actually corresponds to the int value 0 |
| set_div_line_count(hdiv, vdiv) | Sets the number of chart grid lines | hdiv: int type (number of horizontal grid lines, e.g. 3); vdiv: int type (number of vertical grid lines, e.g. 3) | None | Both parameters must be passed together; neither can be omitted |
| set_range(axis, min, max) | Sets the value range of the specified axis | axis: int enum value ( 0=PRIMARY_Y primary Y axis, 1=SECONDARY_Y secondary Y axis, 2=PRIMARY_X primary X axis, 3=SECONDARY_X secondary X axis); min: int type (axis minimum value, e.g. 0); max: int type (axis maximum value, e.g. 100) | None | All three parameters must be passed together; lv.chart.AXIS.PRIMARY_Y corresponds to the int value 0 |
| get_type() | Gets the current chart type | None | int enum value ( 1=LINE line chart, 2=BAR bar chart, etc.) | Corresponds one-to-one with the int value passed to set_type |
| get_point_count() | Gets the currently set number of data points | None | int type (e.g. 10) | Same as the value set by set_point_count |
| get_x_start_point(ser) | Gets the X-axis start point index of the specified data series | ser: lv_chart_series_t struct object (created by add_series) | int type (e.g. 0) | Depends on the series object created by add_series |
| get_point_pos_by_id(ser, id, p_out) | Gets the coordinates of the point in the specified data series by ID | ser: lv_chart_series_t struct object; id: int type (data point ID, e.g. 0); p_out: lv_point_t struct object (stores the coordinate result) | None | The coordinate result is stored in the p_out object; no return value |
| refresh() | Forces a chart refresh to update the data / style display | None | None | Call after updating data to refresh the interface immediately |
| add_series(color, axis) | Adds a data series (line / bar) to the chart | color: lv_color_t struct object (e.g. lv.color_hex(0xFF0000)); axis: int enum value (0=PRIMARY_Y primary Y axis) | lv_chart_series_t struct object | The color does not need to be converted to int; pass the object generated by lv.color_hex directly |
| remove_series(series) | Removes the specified data series from the chart | series: lv_chart_series_t struct object | None | Depends on the series object created by add_series |
| hide_series(series, hide) | Hides / shows the specified data series | series: lv_chart_series_t struct object; hide: bool type (True = hide, False = show) | None | Depends on the series object created by add_series |
| set_series_color(series, color) | Sets the display color of the specified data series | series: lv_chart_series_t struct object; color: lv_color_t struct object | None | Depends on the series object created by add_series |
| set_x_start_point(ser, id) | Sets the X-axis start point index of the specified data series | ser: lv_chart_series_t struct object; id: int type (start point index, e.g. 0) | None | Depends on the series object created by add_series |
| get_series_next(ser) | Gets the next series after the specified data series (used for traversal) | ser: lv_chart_series_t struct object | lv_chart_series_t struct object (returns None if there is no next one) | Depends on the series object created by add_series |
| add_cursor(color, dir) | Adds a cursor to the chart (marks a data point) | color: lv_color_t struct object; dir: int enum value (8=DIR.BOTTOM downward) | lv_chart_cursor_t struct object | None |
| set_cursor_pos(cursor, pos) | Sets the cursor position in the chart | cursor: lv_chart_cursor_t struct object (created by add_cursor); pos: lv_point_t struct object (contains x/y coordinates) | None | Depends on the cursor object created by add_cursor |
| set_cursor_point(cursor, ser, point_id) | Positions the cursor at the specified data point of the specified series | cursor: lv_chart_cursor_t struct object; ser: lv_chart_series_t struct object; point_id: int type (data point ID, e.g. 0) | None | Depends on objects created by add_cursor and add_series |
| get_cursor_point(cursor) | Gets the coordinate point where the cursor is currently positioned | cursor: lv_chart_cursor_t struct object | lv_point_t struct object (contains x/y coordinates) | Depends on the cursor object created by add_cursor |
| set_all_value(series, value) | Sets all data points of the specified series to the same value | series: lv_chart_series_t struct object; value: int type (e.g. 0) | None | Depends on the series object created by add_series |
| set_next_value(ser, value) | Adds the next Y-axis data point to the specified series | ser: lv_chart_series_t struct object; value: int type (e.g. 50) | None | Automatically processes data according to the mode set by set_update_mode |
| set_next_value2(ser, x_value, y_value) | Adds the next X/Y-axis data point to the specified series | ser: lv_chart_series_t struct object; x_value: int type (e.g. 1); y_value: int (e.g., 60) | None | Supports a custom X-axis value, unlike set_next_value |
| set_value_by_id(ser, id, value) | Set the Y-axis value of the data point with the specified ID in the specified series | ser: lv_chart_series_t struct object; id: int (data point ID, e.g., 0); value: int (e.g., 70) | None | Depends on the series object created by add_series |
| set_value_by_id2(ser, id, x_value, y_value) | Set the X/Y-axis values of the data point with the specified ID in the specified series | ser: lv_chart_series_t struct object; id: int (data point ID, e.g., 0); x_value: int (e.g., 2); y_value: int (e.g., 80) | None | Depends on the series object created by add_series |
| set_ext_y_array(ser, array) | Bind an external Y-axis data array to the specified series | ser: lv_chart_series_t struct object; array: list[int] (e.g., [0,10,20,30,40]) | None | Depends on the series object created by add_series |
| set_ext_x_array(ser, array) | Bind an external X-axis data array to the specified series | ser: lv_chart_series_t struct object; array: list[int] (e.g., [0,10,20,30,40]) | None | Depends on the series object created by add_series |
| get_y_array(ser) | Get the Y-axis data array of the specified series | ser: lv_chart_series_t struct object | C Array (int32 []) (equivalent to Python list[int]) | Depends on the series object created by add_series |
| get_x_array(ser) | Get the X-axis data array of the specified series | ser: lv_chart_series_t struct object | C Array (int32 []) (equivalent to Python list[int]) | Depends on the series object created by add_series |
| get_pressed_point() | Get the ID of the data point hit when the user clicks the chart | None | int (2147483647 = no hit; other values are the data point ID) | 2147483647 is equivalent to -1 (no hit) |
| get_first_point_center_offset() | Get the center offset of the first data point of the chart | None | int type (e.g. 10) | The offset is in pixels, used for precise data point positioning |
12.1 Line Chart
In the following code, the following operations are performed:
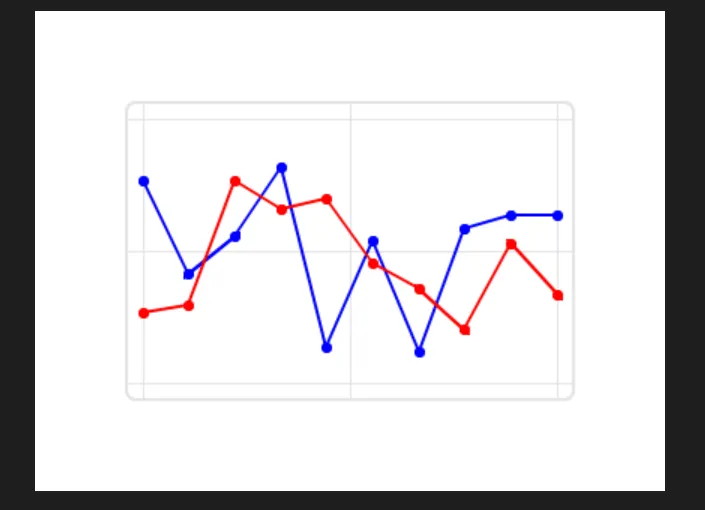
- The screen displays a line chart with a white background and a 3×3 grid, featuring two lines in red and blue that both start at 0.
- Random data is automatically generated every 500ms, the line extends to the right, and the old data disappears after shifting out to the left.
- The terminal continuously outputs English logs:
Updated: ser1= XX, ser2= XX, with no parameter errors whatsoever.
import display_driver
import lvgl as lv
import random
import time

# Initialize the LVGL core engine
lv.init()

# Screen initialization: white background
scr = lv.screen_active()
scr.set_style_bg_color(lv.color_hex(0xFFFFFF), 0)

# ===================== Create and configure the chart =====================
chart = lv.chart(scr)
chart.set_size(300, 200)  # Chart size
chart.center()            # Center on screen

# Core configuration (strictly matches the APIs that passed testing)
chart.set_type(lv.chart.TYPE.LINE)          # Line chart type
chart.set_point_count(10)                   # Number of data points (shows at most 10)
chart.set_update_mode(lv.chart.UPDATE_MODE.SHIFT)  # Data shifts left on update
chart.set_div_line_count(3, 3)              # Grid lines: 3 horizontal + 3 vertical (2 parameters, passed testing)
chart.set_range(lv.chart.AXIS.PRIMARY_Y, 0, 100)  # Y-axis range: 0~100 (3 parameters, passed testing)

# ===================== Add data series =====================
# Pass the color object + AXIS constant directly (passed testing, no int conversion needed)
# Red line
ser1 = chart.add_series(lv.color_hex(0xFF0000), lv.chart.AXIS.PRIMARY_Y)
# Blue line
ser2 = chart.add_series(lv.color_hex(0x0000FF), lv.chart.AXIS.PRIMARY_Y)

# ===================== Initialize data =====================
chart.set_all_value(ser1, 0)  # Initialize the red line to 0 (2 parameters, passed testing)
chart.set_all_value(ser2, 0)  # Initialize the blue line to 0

# ===================== Timer: update data in real time =====================
def update_chart(timer):
    """Timer callback: generate random data and update the chart"""
    val1 = random.randint(20, 80)  # Random value for the red line
    val2 = random.randint(10, 90)  # Random value for the blue line

    chart.set_next_value(ser1, val1)  # Update the red line data
    chart.set_next_value(ser2, val2)  # Update the blue line data

    print(f"Updated: ser1={val1}, ser2={val2}")  # English log output

# Create a timer: 500ms period, repeatedly runs the update function (regular function callback, passed testing)
lv.timer_create(update_chart, 500, None)

# ===================== Load the screen =====================
lv.screen_load(scr)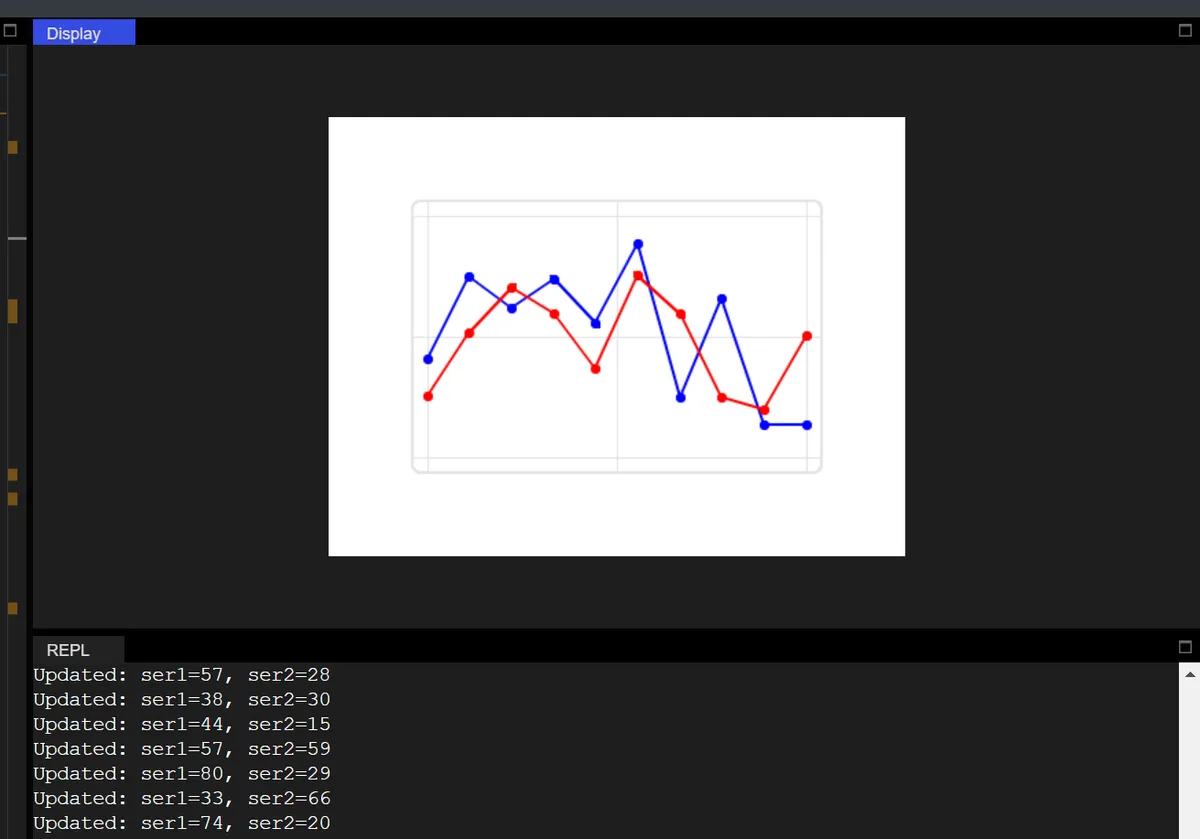
12.2 Bar Chart
The code below displays a bar chart with a white background, consisting of 6 sets of red and blue bars, a Y-axis range of 0 to 100,3 horizontal grid lines and 2 vertical grid lines.
import display_driver
import lvgl as lv
import random
import time

# Initialize the LVGL core engine
lv.init()

# Screen initialization: white background
scr = lv.screen_active()
scr.set_style_bg_color(lv.color_hex(0xFFFFFF), 0)

# Create a bar chart
chart = lv.chart(scr)
chart.set_size(300, 220)  # Set the chart size: width 300, height 220
chart.center()            # Center the chart on screen

# Configure the chart as a bar chart type (pass lv.chart.TYPE.BAR directly, passed testing)
chart.set_type(lv.chart.TYPE.BAR)
# Set the number of data points (number of bars): 6
chart.set_point_count(6)
# Set the grid lines: 3 horizontal lines, 2 vertical lines (2 parameters, passed testing)
chart.set_div_line_count(3, 2)
# Y-axis range 0~100
chart.set_range(lv.chart.AXIS.PRIMARY_Y, 0, 100)

# First group: red bars, using the primary Y axis (pass the color object + AXIS constant directly, passed testing)
ser1 = chart.add_series(lv.color_hex(0xFF5733), lv.chart.AXIS.PRIMARY_Y)
# Second group: blue bars, using the primary Y axis
ser2 = chart.add_series(lv.color_hex(0x3377FF), lv.chart.AXIS.PRIMARY_Y)

# Set the first group of data
data1 = [30, 45, 28, 67, 50, 75]
for idx, value in enumerate(data1):
    # Set the Y-axis values one by one by ID
    chart.set_value_by_id(ser1, idx, value)

# Set the second group of data
data2 = [20, 55, 38, 47, 60, 55]
for idx, value in enumerate(data2):
    chart.set_value_by_id(ser2, idx, value)

# Load the screen
lv.screen_load(scr)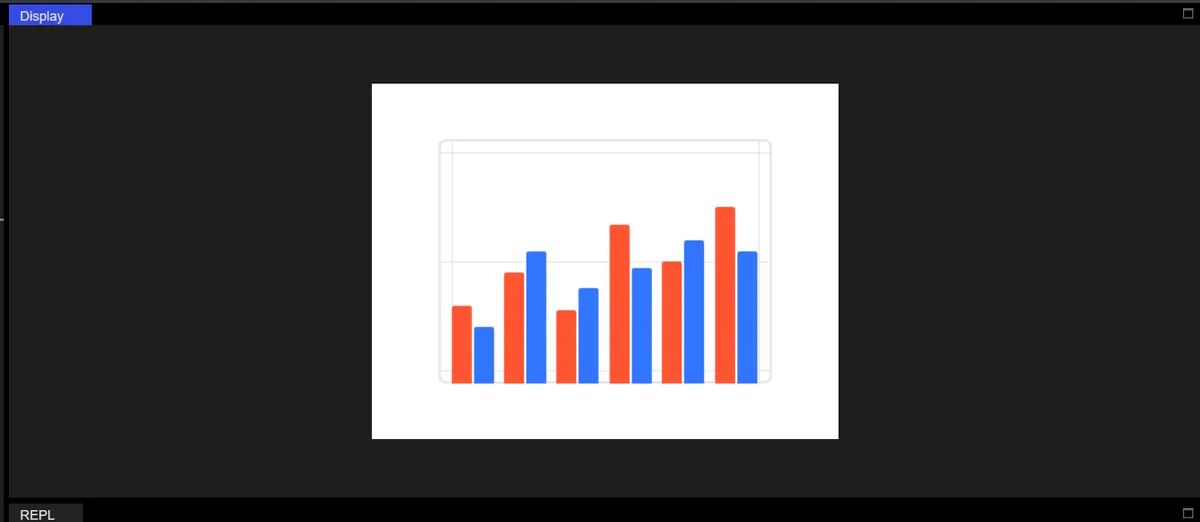
12.3 Scatter Plot
It should be noted that the SCATTER type of LVGL is not a scatter plot in the traditional sense that only displays independent discrete points. Instead, it automatically connects adjacent Data Points of the same series with broken lines, presenting the effect of a "broken line with Data Points", which is significantly different from the conventional scatter plot without connecting lines that we commonly recognize.This feature makes it more suitable for trajectory update scenarios, such as real-time display of device movement trajectories (e. g., sensor positions, mobile terminal positioning), dynamic change trajectories of multi-dimensional indicators (e. g., XY-axis trend tracking of industrial monitoring data), etc. It can intuitively present the continuous change path of the same type of data on the XY plane, rather than simply displaying the distribution of discrete points.
import display_driver
import lvgl as lv
import time
import random

# ===================== 1. Initialize the LVGL environment =====================
lv.init()
scr = lv.screen_active()
scr.set_style_bg_color(lv.color_hex(0x000000), 0)  # Black background to make the scatter points stand out

# ===================== 2. Core configuration for creating a planar scatter chart =====================
chart = lv.chart(scr)
chart.set_size(400, 300)  # Larger size, suited to XY dual-axis distribution
chart.center()

# Key configuration: dual-axis scatter chart
chart.set_type(lv.chart.TYPE.SCATTER)          # Pure scatter chart type
chart.set_point_count(20)                      # Shows at most 20 scatter points (shift update)
chart.set_update_mode(lv.chart.UPDATE_MODE.CIRCULAR)  # New points added on the right, old points shift left
chart.set_div_line_count(5, 5)                 # 5 horizontal and 5 vertical grid lines, evenly dividing the XY axes

# Set the XY dual-axis ranges (planar coordinate system: X 0-100, Y 0-100)
chart.set_range(lv.chart.AXIS.PRIMARY_X, 0, 100)  # X-axis range
chart.set_range(lv.chart.AXIS.PRIMARY_Y, 0, 100)  # Y-axis range

# ===================== 3. Add three-color scatter series (different XY ranges) =====================
# Red scatter points: upper-left region (X 10-30, Y 70-90)
ser_red = chart.add_series(lv.color_hex(0xFF0000), lv.chart.AXIS.PRIMARY_Y)
# Blue scatter points: middle region (X 40-60, Y 40-60)
ser_blue = chart.add_series(lv.color_hex(0x0000FF), lv.chart.AXIS.PRIMARY_Y)
# Yellow scatter points: lower-right region (X 70-90, Y 10-30)
ser_yellow = chart.add_series(lv.color_hex(0xFFFF00), lv.chart.AXIS.PRIMARY_Y)

# ===================== 4. Initialize scatter data (initially 0) =====================
chart.set_all_value(ser_red, 0)
chart.set_all_value(ser_blue, 0)
chart.set_all_value(ser_yellow, 0)

# ===================== 5. Timer: update the planar scatter in real time (random XY) =====================
def update_scatter(timer):
    """Generate random XY values in different ranges and update the planar scatter points"""
    # Red: upper-left region (X 10-30, Y 70-90)
    x_red = random.randint(10, 30)
    y_red = random.randint(70, 90)
    chart.set_next_value2(ser_red, x_red, y_red)  # Dual-axis update: X+Y

    # Blue: middle region (X 40-60, Y 40-60)
    x_blue = random.randint(40, 60)
    y_blue = random.randint(40, 60)
    chart.set_next_value2(ser_blue, x_blue, y_blue)

    # Yellow: lower-right region (X 70-90, Y 10-30)
    x_yellow = random.randint(70, 90)
    y_yellow = random.randint(10, 30)
    chart.set_next_value2(ser_yellow, x_yellow, y_yellow)

    # Print real-time coordinates (optional, to view the data)
    print(f"Red({x_red},{y_red}) | Blue({x_blue},{y_blue}) | Yellow({x_yellow},{y_yellow})")

# Create a timer: update the scatter points every 600ms
lv.timer_create(update_scatter, 600, None)

# ===================== 6. Load the screen and keep running =====================
lv.screen_load(scr)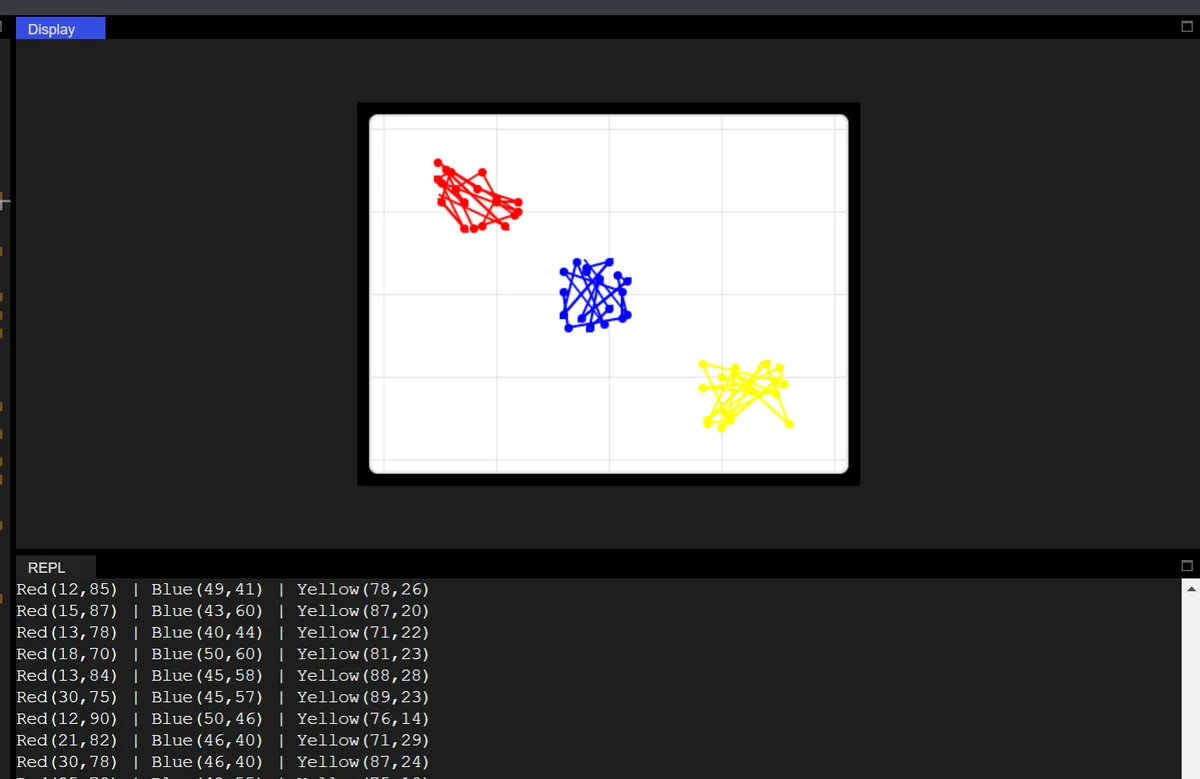
In the code above, a dynamic scatter plot effect with dual XY axes is implemented based on the LVGL graphics library: first, initialize a chart with a black background, configure the value range of 0-100 for both X and Y axes and 5×5 uniform grid lines, create three data series in red, blue and yellow corresponding to different XY coordinate intervals of upper left, middle and lower right respectively, generate random XY coordinates for the corresponding interval every 600ms via a timer, and use the set_next_value2 method to update the dual-axis Data Point of each series, so as to realize the dynamic refresh of data.
Version Record
Version Number | Modifier | Time | Content |
v1.0 | Li Zisheng | 2026/03/23 | Initialize the document. |