Contents
- I. Module Introduction
- II. Introduction to Main Chips
- 2.1 Chip Overview
- 2.2 Pin Definition
- 2.3 Functional Block Diagram
- 2.4 Performance Parameters
- 2.5 Reference Circuit
- 2.6 Chip Configuration
- 2.7 Communication Interfaces and Related Protocols
- 2.8 PCB Routing Precautions
- III. Instructions for Circuit Engineering and Module Usage
- 3.1 Circuit Source Engineering
- 3.2 Module Usage Instructions
- 3.3 Application Experiment
- IV. Drivers
- 5. BOM & Recommended Alternative Parts
- VI. Revision History
- VII. Relevant Materials
- 7.1 Chip Datasheet
- 7.2 Unique Icons for PCB Silk Screen
I. Module Introduction
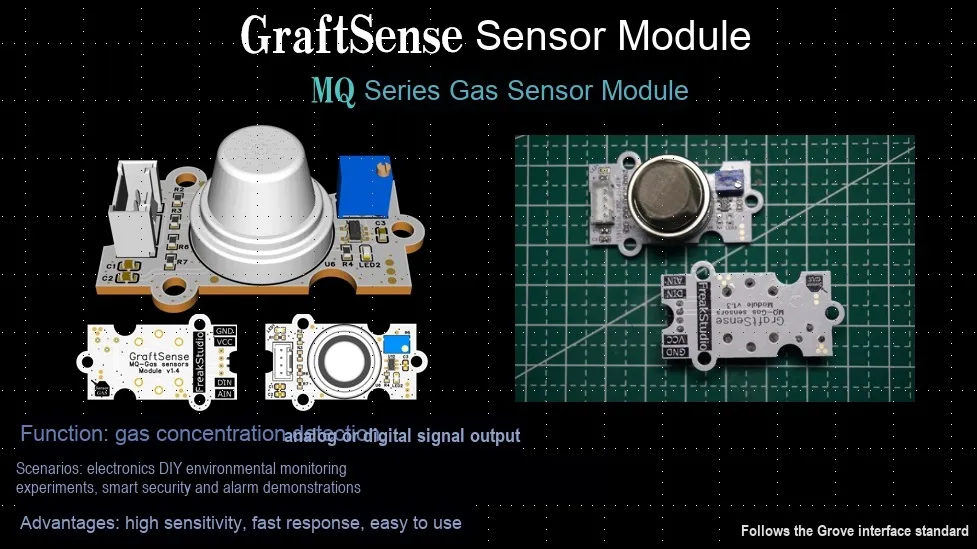
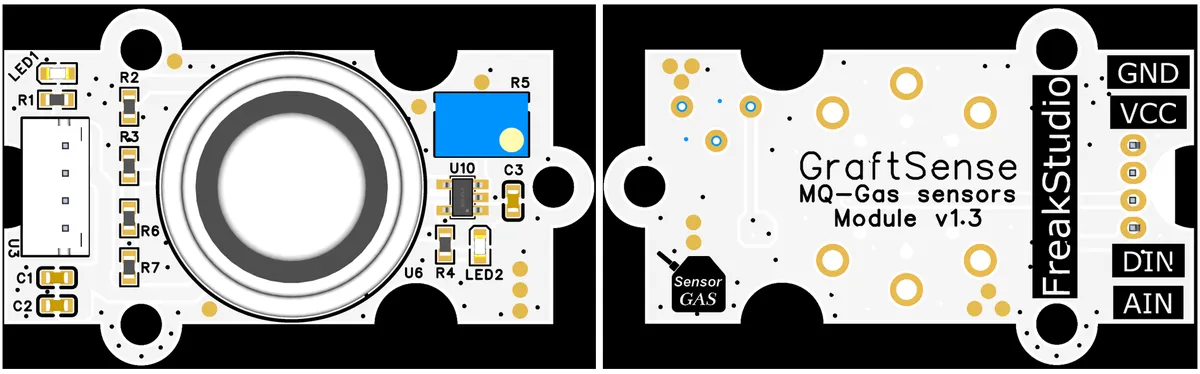
MQ series gas sensor module is designed to detect the concentration of specific gases in the air, enabling functions such as safety alarm, air quality monitoring and environmental analysis. This module is a general-purpose MQ series gas sensor module, which integrates gas-sensitive elements and signal conditioning circuits inside, features both analog output and digital output functions, is compatible with multiple models of MQ sensor probes, and can be quickly integrated into gas detection and environmental monitoring projects.
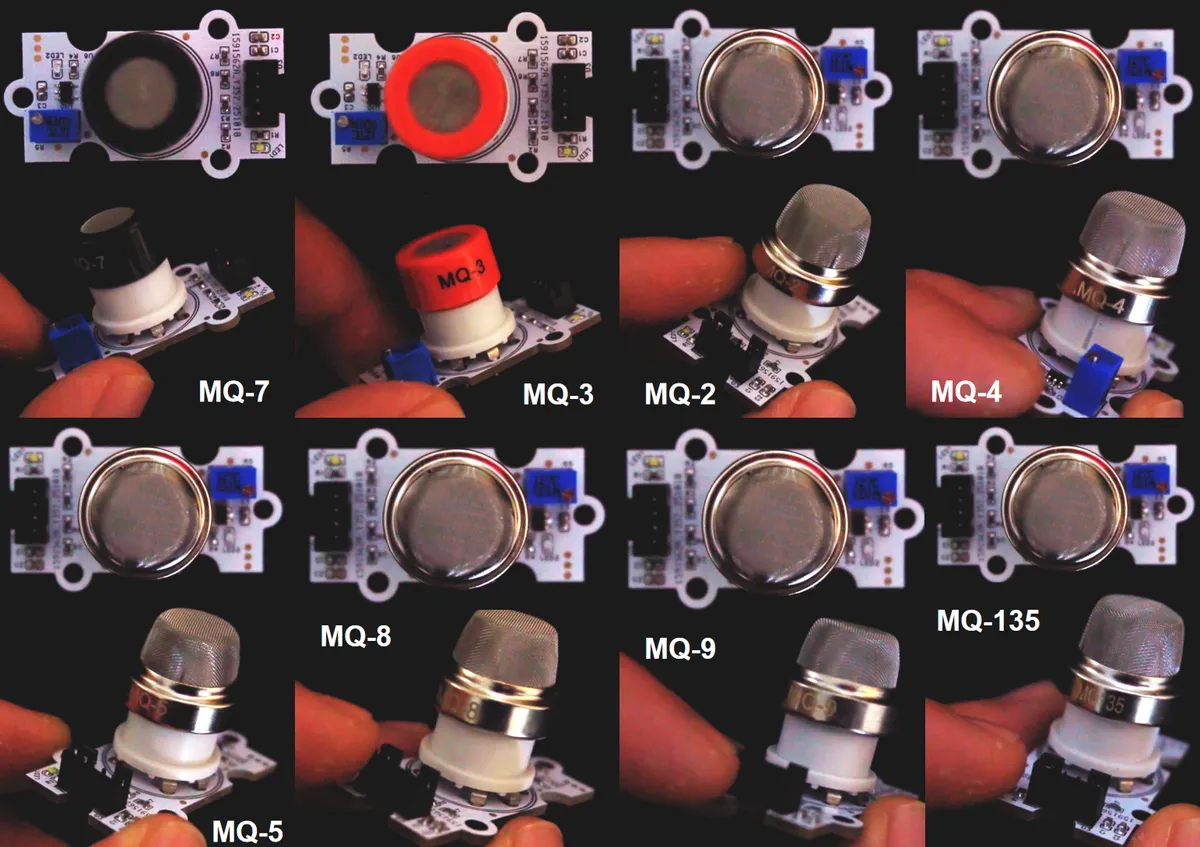
In scenarios where precision requirements are relaxed, this circuit can directly adapt to the following MQ series gas sensor probes:
Sensor Model | Test Gas | Heating Resistor Compatibility | Load Resistance Compatibility | Typical Scenarios |
MQ-2 | Smoke and liquefied petroleum gas | 33Ω(perfect match) | 10 kΩ(perfect match) | Smoke alarm and gas leak detection |
MQ-4 | Methane, natural gas | 33Ω(Compatible) | 2 kΩ(can be relaxed to 10 kΩ) | Residential natural gas leak monitoring |
MQ-5 | Liquefied Petroleum Gas (LPG) | 31Ω(Compatible) | 10 kΩ(perfect match) | Liquefied Petroleum Gas Cylinder Leak Detection |
MQ-6 | Propane, butane | 31Ω(Compatible) | 20 kΩ(can be relaxed to 10 kΩ) | Industrial Combustible Gas Alarm |
MQ-135 | Formaldehyde, ammonia | 31Ω(Compatible) | 10 kΩ(perfect match) | Indoor Air Pollution Monitoring |
If only qualitative testing is required, all the following probes are supported:
| Model | Name | Main Detected Gases | Typical application scenarios |
|---|---|---|---|
| MQ-2 | Smoke / Combustible Gas Sensor | Smoke, LPG, propane, hydrogen, etc. | Fire alarms, household gas leak detection |
| MQ-3 | Alcohol Sensor | Alcohol vapor | Drunk driving detection, alcohol concentration monitoring equipment |
| MQ-4 | Methane Sensor | Methane, natural gas | Natural gas leak detection, mine gas monitoring |
| MQ-5 | LPG / City Gas Sensor | LPG, city gas, methane, and other combustible gases | Household gas leak detection, industrial gas monitoring |
| MQ-7 | Carbon monoxide sensor | Carbon monoxide | Gas poisoning prevention, industrial exhaust monitoring |
| MQ-8 | Hydrogen Sensor | Hydrogen | Hydrogen leak detection, fuel cell system monitoring |
| MQ-9 | Carbon Monoxide / Combustible Gas Sensor | Carbon monoxide, methane, LPG, etc. | Compound gas leak alarms, industrial safety monitoring |
| MQ-135 | Air Quality Sensor | Ammonia, nitrogen oxides, alcohol, smoke, CO₂, etc. | Indoor air quality monitoring, harmful gas alarms |
II. Introduction to Main Chips
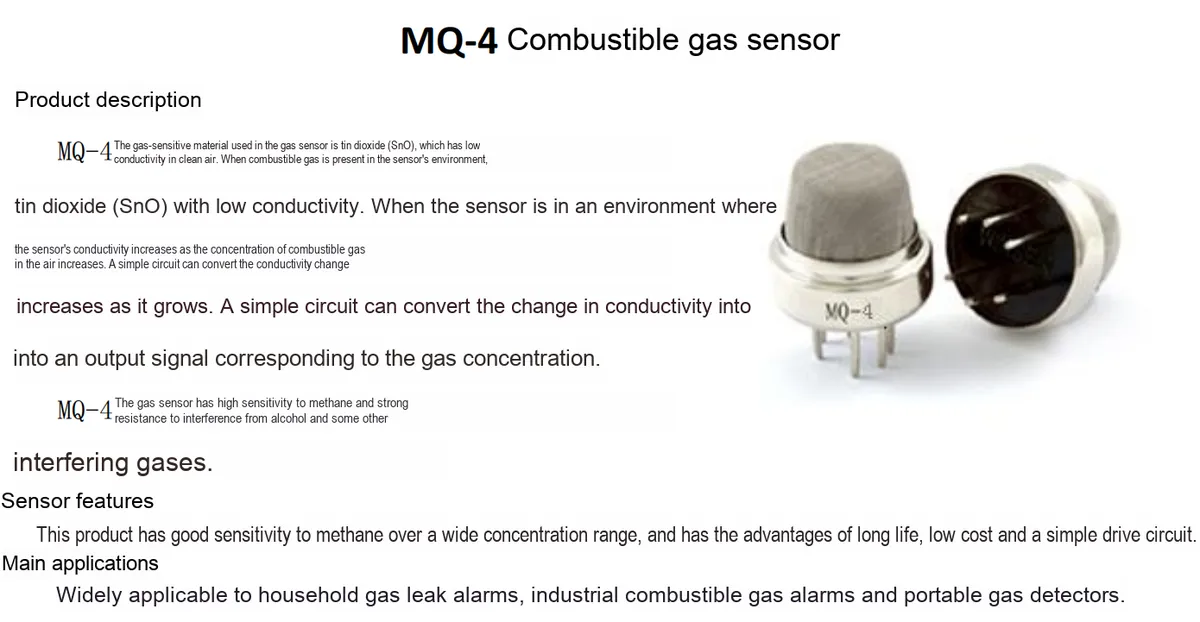
This module has no traditional integrated circuit chips, and its core is MQ series gas-sensitive elements and TLV3201 operational amplifiers.
Next, taking the MQ-4 gas sensor as an example, we will explain the key parameters and pin functions of the MQ series gas sensors.
2.1 Chip Overview
2.2 Pin Definition
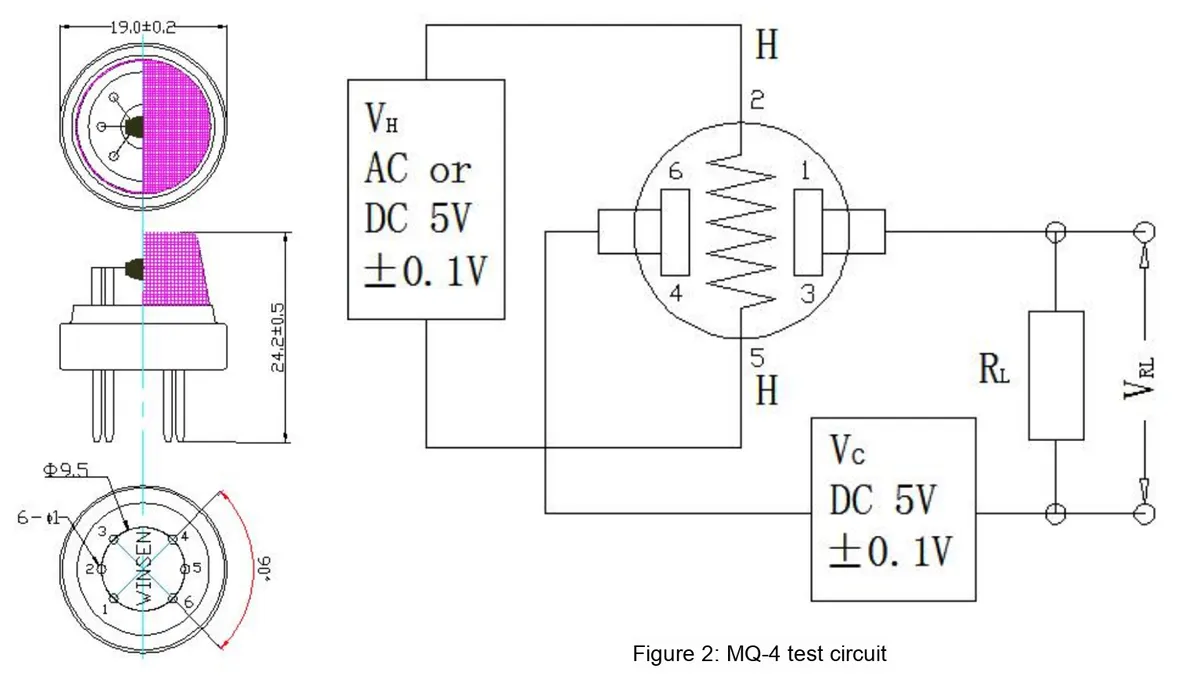
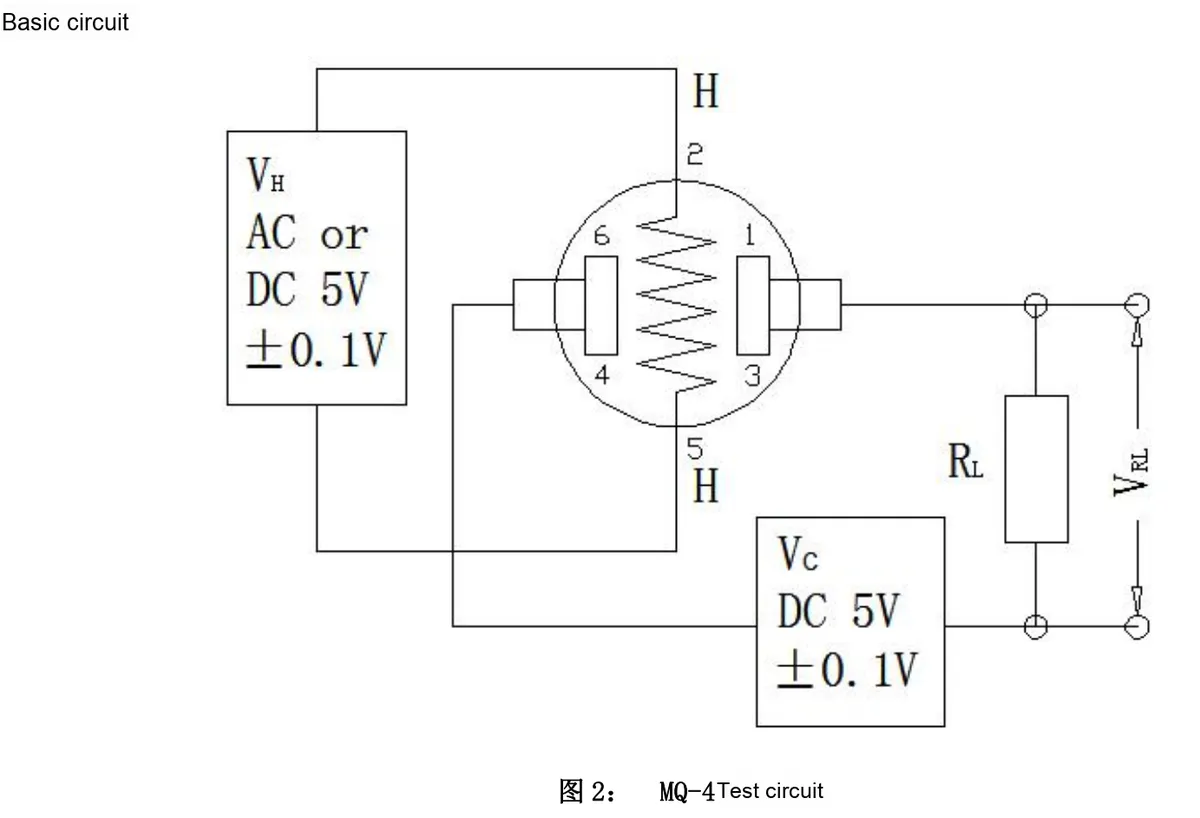
MQ series sensors (such as MQ-2, MQ-3, MQ-4, MQ-5, MQ-135, etc.) adopt a 6-pin metal package, and their pin functions are highly consistent, with the core rule as follows:
Pin Number | Function Definition | Typical Connections | Note |
Pins 2 and 5 | Heating resistor pin (Heater) | Connect to 5V power supply (VH) | It supplies power to the internal heating wire of the sensor, requiring a constant 5V (some models such as MQ-7 require high-low voltage switching) |
Pins 1 and 3 | Test Electrode A (Sensitive A) | Connect the load resistor (RL) | Pins 4 and 6 internally connect to the two terminals of a sensitive resistor, which outputs analog signals |
Pins 4 and 6 | Test Electrode B (Sensitive B) | Connect to the power supply (Vc, typically 5V) | The other terminal of the sensitive resistor forms a voltage divider circuit with pins 1 and 3. |
MQ sensor has its 6 pins arranged in a circular pattern:
- Heating wire: The resistance between pin 2 and pin 5 (typical value: 30~33Ω), which heats up the sensor surface after being energized to remove the gas condensation film;
- Sensitive resistor: The semiconductor material (such as
SnO₂) between pins 1-3 and pins 4-6 will have its resistance value changed with the variation of gas concentration.
For some models, the pin functions are slightly adjusted due to different heating methods:
MQ-7(carbon monoxide sensor): requires high-low temperature cyclic heating (heating at 5V for 1 minute + maintaining at 1.4V for 5 minutes). Therefore, pins 2 and 5 still serve as heating pins, but an externalMOSFETorPWMcircuit is required to control voltage switching;MQ-8(Hydrogen Sensor): Adopts a pulse heating mode, and pins 2 and 5 need to be connected to a periodic pulse power supply (e. g., 100ms high level + 900ms low level).
2.3 Functional Block Diagram
None.
2.4 Performance Parameters
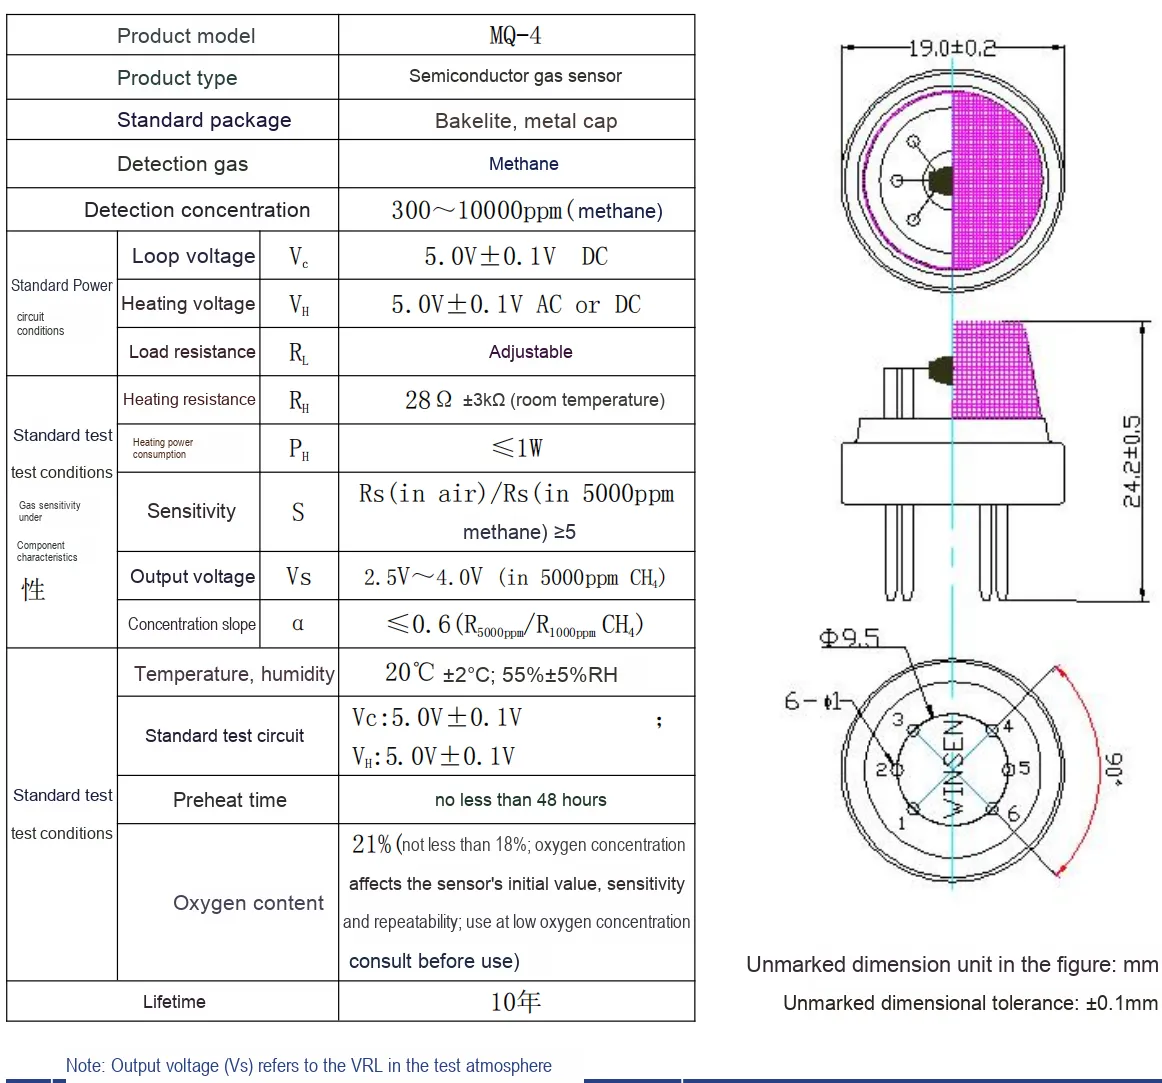
| Parameter Category | Parameter Name | Value / Description |
| Basic Product Information | Product Model | MQ-4 |
| Product Type | Semiconductor gas sensor | |
| Standard Package | Bakelite, metal cap | |
| Detected Gas | Methane | |
| Detection Concentration | 300~10000 ppm (methane) | |
| Standard Circuit Conditions | Circuit Voltage (Vc) | 5.0V±0.1V DC (operating voltage of the test circuit, used for signal conversion) |
| Heater Voltage (VH) | 5.0V±0.1V AC or DC (operating voltage of the heating element, maintains semiconductor activity) | |
| Load Resistance (RL) | Adjustable (in series with the sensor's sensing electrode, used to adjust the output voltage range) | |
| Characteristics of the Gas-Sensing Element under Standard Test Conditions | Heater Resistance (RH) | 28Ω±3Ω (at room temperature, resistance of the heating element, reflects the state of the heating circuit) |
| Heater Power Consumption (PH) | ≤1W (power consumed by the heating element during operation, avoid overload damage) | |
| Sensitivity (S) | Rs (in air)/Rs (in 5000ppm methane)≥5 (ratio of resistance in air to resistance in 5000ppm methane, reflects sensitivity to methane) | |
| Output Voltage (Vs) | 2.5V~4.0V (in 5000ppm CH₄) (divided output voltage at 5000ppm methane concentration, can be measured directly) | |
| Concentration Slope (α) | ≤0.6 (R5000ppm/R1000ppm CH₄) (ratio of resistance at different concentrations, reflects the ability to resolve concentration changes) | |
| Standard Test Environment Requirements | Temperature, Humidity | 20℃±2℃; 55%±5% RH (ambient conditions during testing, ensures parameter consistency) |
| Standard Test Circuit | Vc:5.0V±0.1V; VH:5.0V±0.1V (circuit parameters during testing, ensure standardized performance testing) | |
| Usage-Related Parameters | Preheat Time | No less than 48 hours (power on to stabilize for first use or after long idle, eliminates initial drift) |
| Oxygen Content | 21% (not less than 18%, oxygen concentration affects sensor performance, consult the manufacturer for low-oxygen environments) | |
| Lifespan | 10 years (effective service life under normal use) |
2.4.1 Typical Sensitivity Characteristic Curve of Sensors
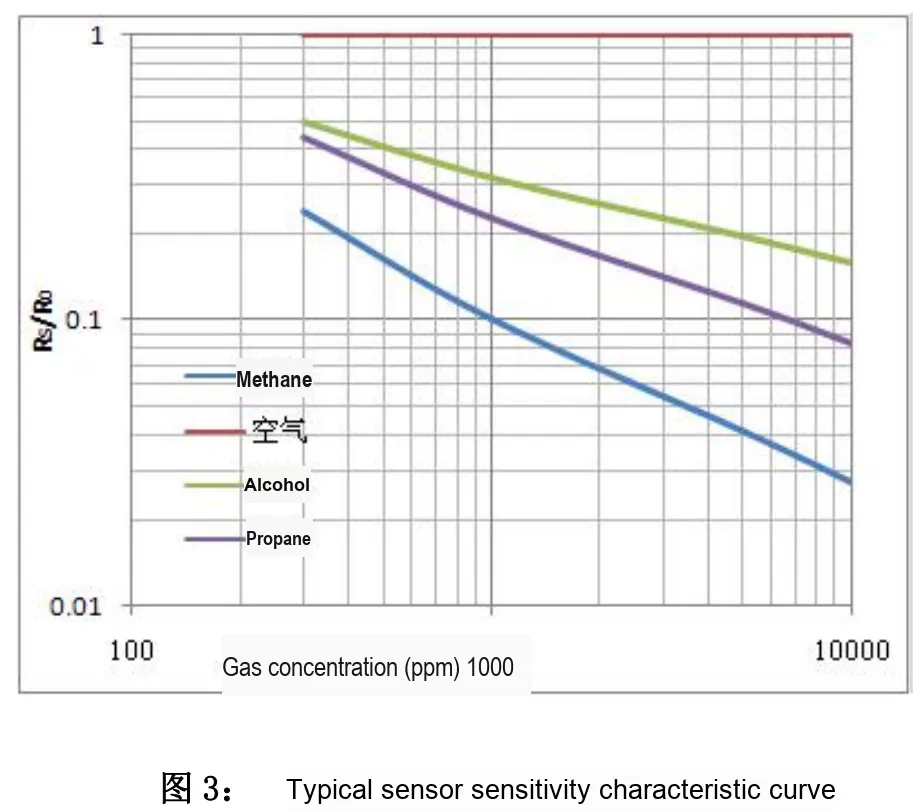
In this sensitivity characteristic curve, the ordinate is the ratio of the resistance of the sensor in gas to the resistance in clean air ( Rs/R0 ), and the abscissa is the gas concentration; the air curve (red) Rs/R0 is always 1 (as a reference), the methane curve (blue) decreases rapidly and significantly with the increase of concentration, Rs/R0 (the highest sensitivity to methane), and the alcohol (green) and propane (purple) curves decrease in turn, reflecting the optimal selectivity and sensitivity of the sensor to methane, and the sensitivity to the target gas increases with the increase of concentration.
2.4.2 Typical Temperature and Humidity Characteristic Curves of Sensors
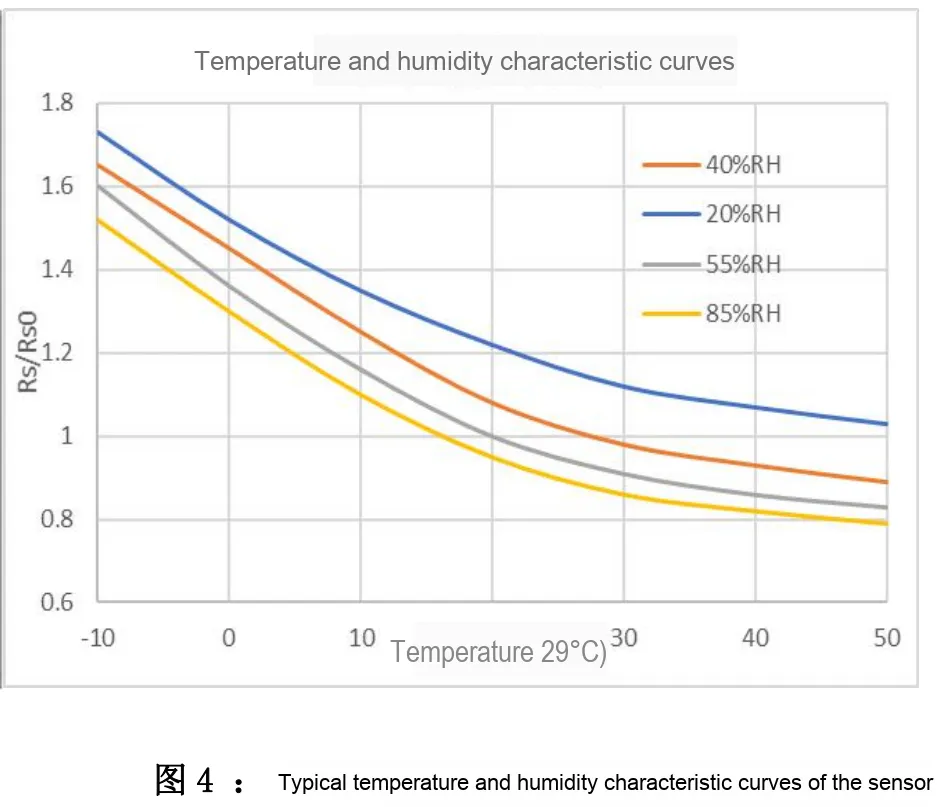
In this temperature and humidity characteristic curve, the ordinate represents the ratio of the sensor's resistance in a 5000ppm methane environment at different temperatures and humidities to the reference resistance under the condition of " RH 20℃/55%, 5000ppm methane", Rs/RS0; the abscissa is temperature, and curves in different colors correspond to different relative humidity (RH). On the whole, in a 5000ppm methane environment, the resistance ratio of the sensor decreases as the temperature rises;Moreover, at the same temperature, the higher the humidity (e. g., 85% RH), the more significant the decrease in the resistance ratio, indicating that changes in temperature and humidity will significantly affect the methane detection characteristics of the sensor, and the increase in humidity and temperature will amplify the degree to which the sensor resistance drops relative to the reference state.
2.4.3 Sensitivity Characteristic Curve
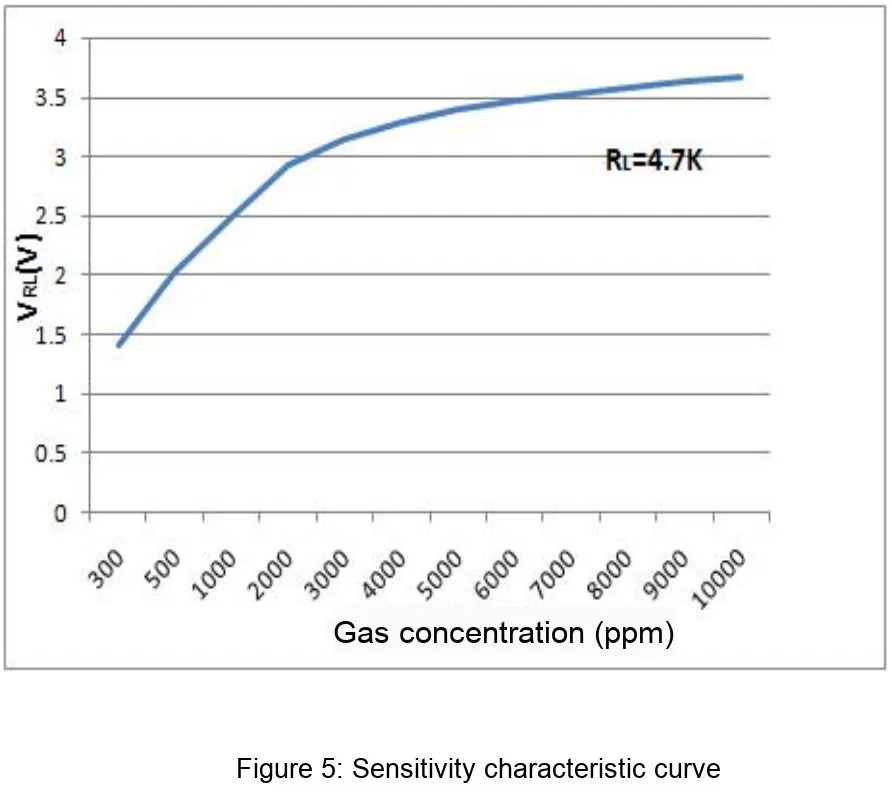
This graph illustrates the load resistance RL and the variation characteristic of the sensor's load voltage VRL under different methane concentrations when RL is fixed. Based on the principle of semiconductor gas sensors that "the sensitive resistance decreases as methane concentration increases", when the methane concentration rises from approximately 300 ppm to 10000 ppm, the sensor's sensitive resistance gradually decreases, which changes the voltage division relationship between RL and the sensitive resistance, VRL gradually increases from about 1.5V to above 3.5V (the rising trend is fast at first and then slows down);This indicates that VRL increases with the rise of methane concentration, which can indirectly reflect the level of methane concentration via VRL and also embodies the response characteristics of the sensor in different concentration ranges.
2.4.4 Response Recovery Characteristic Curve
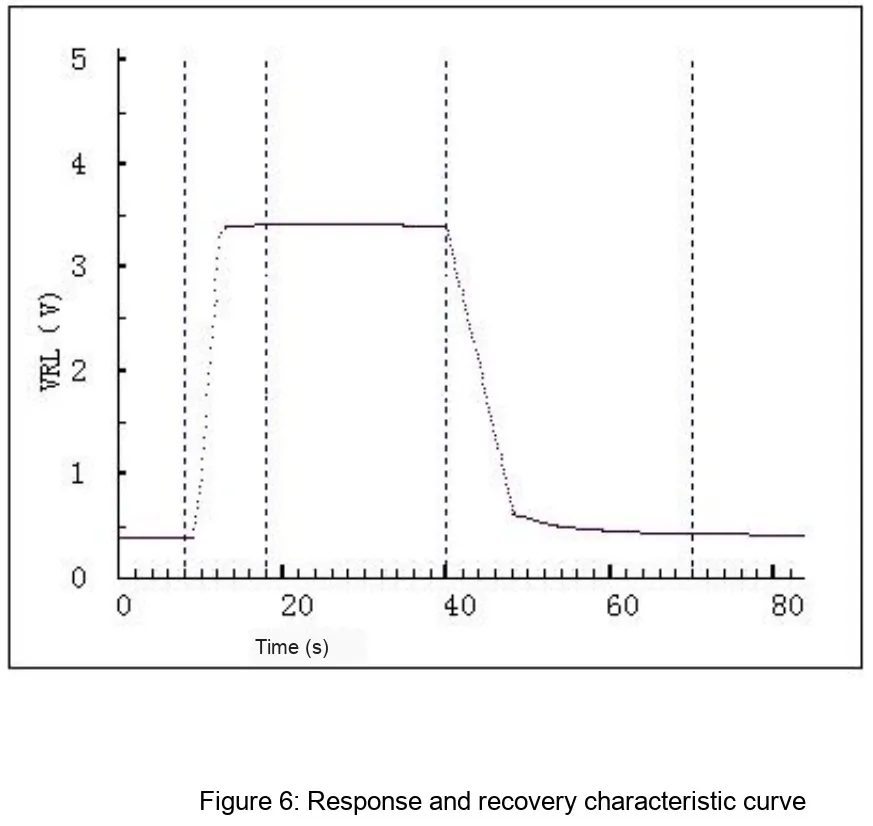
This response and recovery characteristic curve illustrates the load voltage VRL changes of the sensor during the process of "exposure to the test atmosphere — removal of the test atmosphere": upon exposure to the atmosphere, VRL rises rapidly to a stable high value (the response phase, which reflects the sensor's rapid response capability to the target gas); after the atmosphere is removed, VRL drops quickly and gradually recovers to a value close to the initial level (the recovery phase, which reflects the process of desorption of the adsorbed gas and recovery of the sensor's resistance, indicating its favorable recovery characteristics).
2.4.5 Long-term Stability Observation Curve
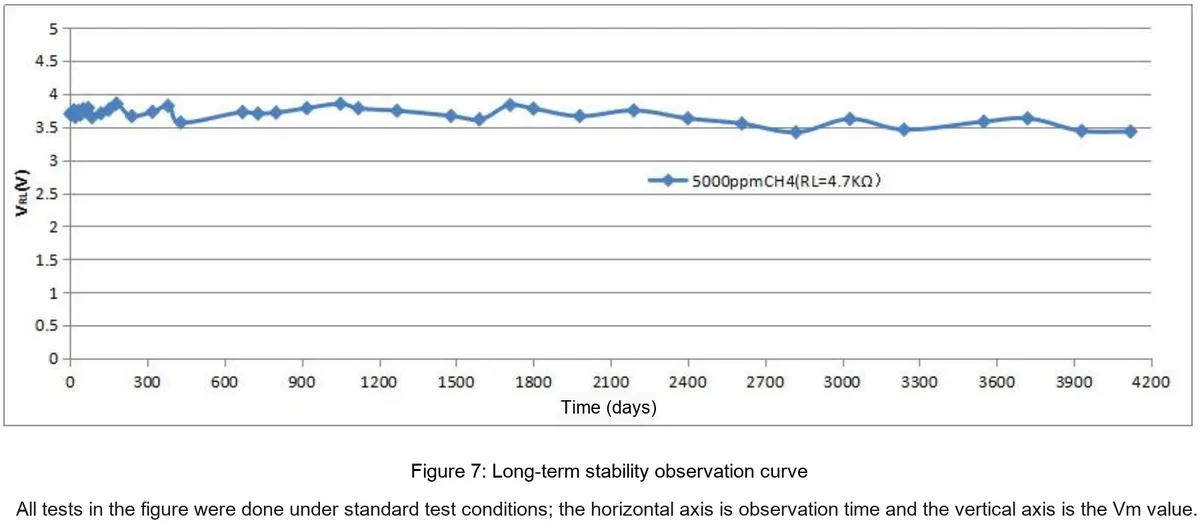
This long-term stability observation curve shows that under standard test conditions, when the sensor is used to detect 5000ppm methane for up to approximately 11 years (4200 days), the load voltage VRL has slight fluctuations, but stays within the range of 3.5V to 4V as a whole with no obvious continuous drift trend, which reflects that the sensor features excellent long-term stability and can meet the reliability requirements for long-time continuous methane detection.
2.5 Reference Circuit

2.6 Chip Configuration
None.
2.7 Communication Interfaces and Related Protocols
None.
2.8 PCB Routing Precautions
There are no special requirements, except that this electronic module requires a relatively large current (about 200mA), so pay attention to widening the traces during wiring.
III. Instructions for Circuit Engineering and Module Usage
3.1 Circuit Source Engineering
To obtain the circuit source project, please follow the official account [Freak Embedded]
3.2 Module Usage Instructions
The schematic diagram of this module is shown below:
SCH_Schematic1_MQ Series Electrochemical Gas Sensor Module_v1.3_2025-10-09.pdf 3.1 MB
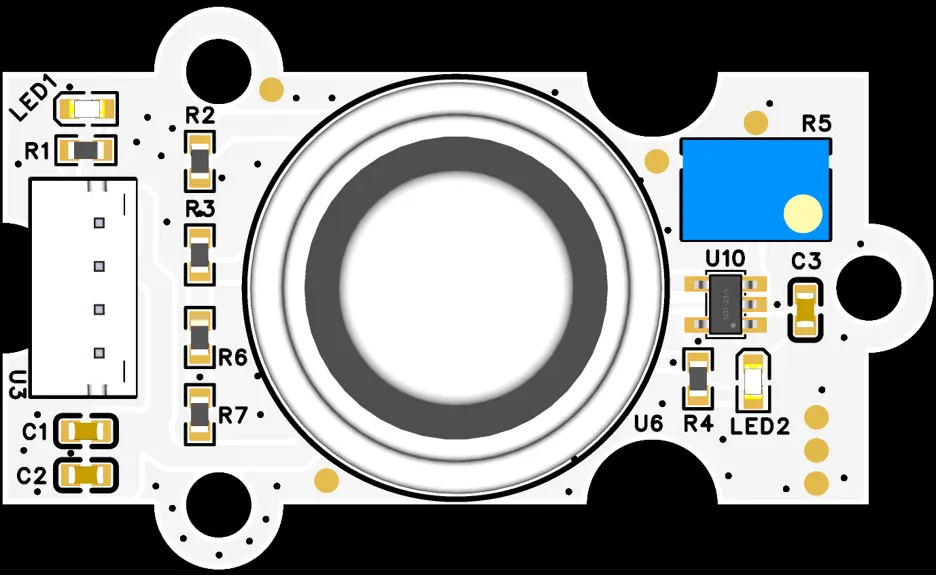
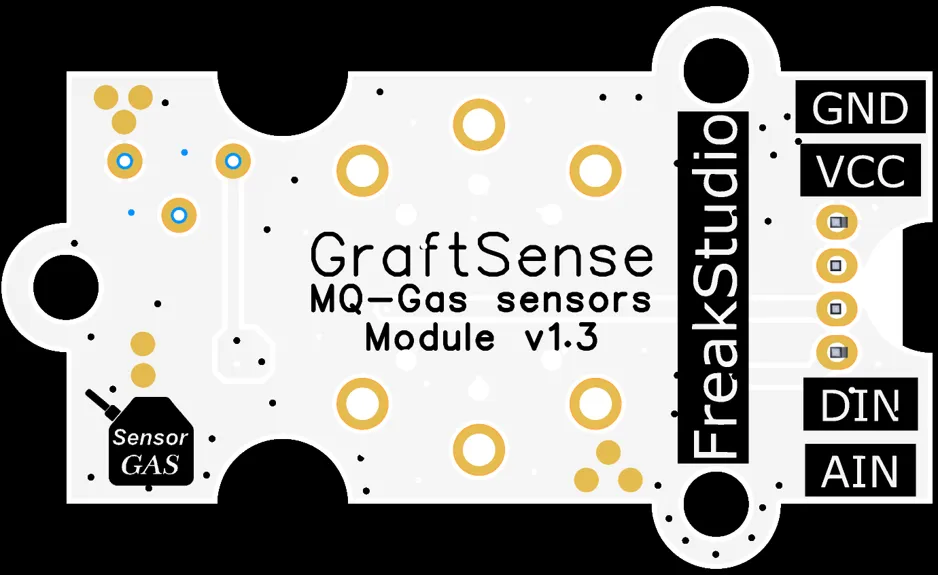
This module provides two types of output interfaces:
- Analog Output (
AIN): This is the output of the amplified original analog signal. Users can directly acquire it through the ADC (Analog-to-Digital Converter) pin of the main control chip to read the amplified analog voltage value. - Digital Output (
DIN): This is the digital signal output processed by the voltage comparator. It is a high-level or low-level signal that can be directly connected to the GPIO pin of the main control chip. When the voltage ofAINis higher than the set threshold voltage,DINoutputs one level; when the voltage is lower than the threshold, it outputs another level, which can be used for signal threshold judgment or state detection.
As shown in the schematic diagram, the core of its circuit consists of three parts:
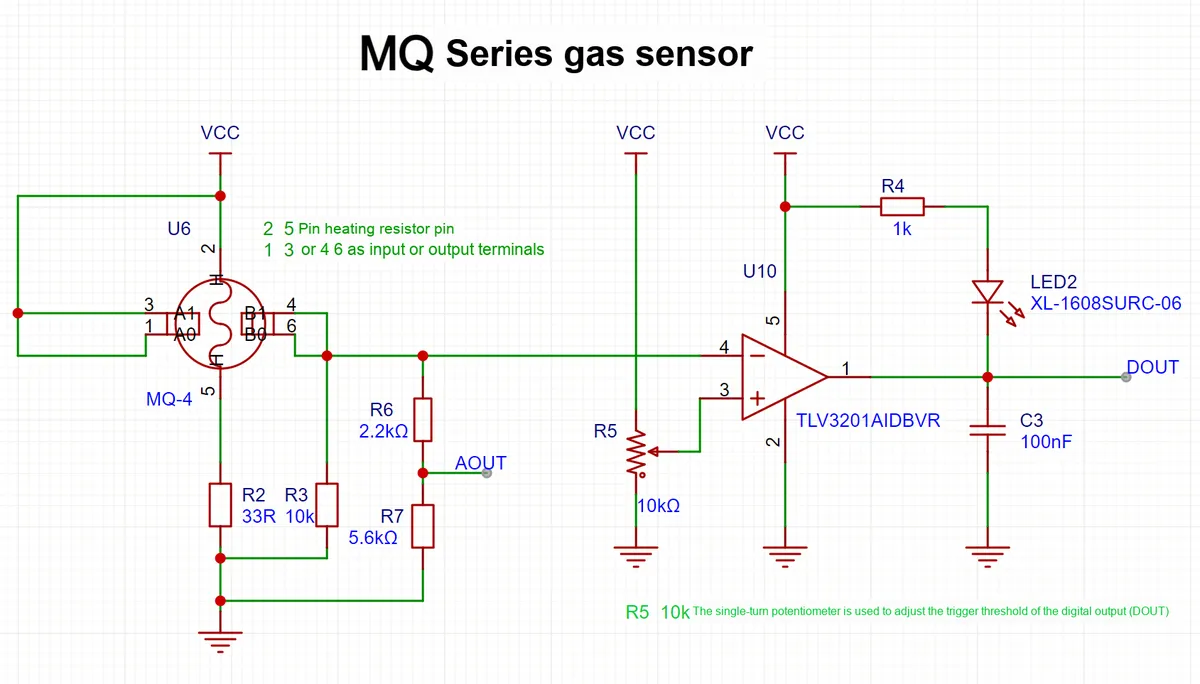
- Heating circuit (to ensure sensor activity): Supplies
MQpower to the internal heating wire of the element, so as to activate the sensitive layer and restore its sensitivity. - Analog signal output circuit (for quantitative concentration detection): It
converts the resistance change of the MQcomponent into a voltage (AOUT), which is used for ADC sampling and gas concentration calculation (Rs→Rs/R0→ppm). - Digital signal output circuit (over-limit alarm): The comparator compares the analog voltage with the threshold, outputs a digital alarm signal (
DOUT) and drives theLED.
Adjusting R5 (10kΩ) will change the threshold level of the voltage comparison circuit, thereby affecting the "alarm trigger point" of the module for the concentration of sensitive gas. The larger the resistance value, the higher the concentration of sensitive gas required to trigger an alarm; the smaller the resistance value, the lower the concentration of sensitive gas required to trigger an alarm.
MQ series gas sensors (taking MQ-4 as an example) feature a sensitive resistance that gradually decreases as the target gas concentration rises; the inverting terminal of the voltage comparator TLV3201 in the circuit is connected to the analog signal of the sensor, while its non-inverting terminal is connected to a potentiometer R5 (10kΩ single-turn) to set the concentration threshold voltage. Combined with the conduction logic between the DOUT level and LED2, the detection and indication of gas concentration are realized.
DOUToutput andLED2lighting rules:- When the gas concentration is low, the sensitive resistance of the sensor is large, the voltage at the inverting terminal is lower than the threshold voltage at the non-inverting terminal, and the comparator outputs a high level (
DOUTis high);LED2has its cathode connected to a high level, there is no sufficient forward voltage across it, andLED2turns off. - When the gas concentration rises above the threshold, the sensitive resistance of the sensor decreases, the voltage at the inverting input terminal becomes higher than the threshold voltage at the non-inverting input terminal, and the comparator outputs a low level (
DOUTis low); whenDOUTis at a low level,VCCsupplies a forward current toR4to powerLED2, turningLED2on.
- When the gas concentration is low, the sensitive resistance of the sensor is large, the voltage at the inverting terminal is lower than the threshold voltage at the non-inverting terminal, and the comparator outputs a high level (
Meanwhile, in the circuit, R6 = 2.2 kΩ and R7 = 5.6 kΩ form a voltage divider circuit; the output voltage of the MQ-4 is divided by this circuit to generate AOUT. Assuming the maximum output voltage of the MQ sensor probe is 4.5 V, the voltage after division is calculated as: VAOUT = 4.5 × 5.6/(2.2+ 5.6) ≈ 4.5 × 0.718 ≈ 3.23 V. This voltage is lower than the 3.3 V input upper limit of the ADC peripheral of most MCUs, so it will not damage the ADC while retaining a sufficient signal range.
When the accuracy requirements are relaxed, this circuit is compatible with the following MQ series sensor probes:
- Fully compatible models (with highly matched circuit parameters):
MQ-2(Smoke / Combustible Gas Sensor)- Heating method: 5V constant heating, with a heating resistance of approximately 33Ω(completely matching
R2= 33Ω in the circuit); - Load resistance: 10kΩ is recommended (consistent with
R3= 10kΩ in the circuit); - Pin Definition: Pins 2 and 5 are heating pins, and pins 1,3/4, and 6 are signal pins, which are compatible with the circuit;
- Scenario: Applicable to smoke alarm and liquefied petroleum gas (LPG) leakage detection.
- Heating method: 5V constant heating, with a heating resistance of approximately 33Ω(completely matching
MQ-4(Methane / Natural Gas Sensor)- Heating method: 5V constant heating, the typical value of heating resistance is 33Ω(compatible with the circuit
R2= 33Ω); - Load resistance: 2kΩ is recommended (when precision requirements are relaxed, the 10kΩ in the circuit can be used as an emergency substitute);
- Pin Definition: Pins 2 and 5 are heating pins, and pins 1,3/4, and 6 are signal pins;
- Scenario: Applicable for domestic natural gas leak detection.
- Heating method: 5V constant heating, the typical value of heating resistance is 33Ω(compatible with the circuit
MQ-5(Liquefied Petroleum Gas / Propane Sensor)- Heating Method: 5V constant heating, with a heating resistance of 26Ω±3Ω(close to 33Ω, compatible);
- Load resistance: Recommended 10kΩ(consistent with circuit
R3= 10kΩ); - Pin Definition: Pins 2 and 5 are heating pins, and pins 1,3/4, and 6 are signal pins;
- Scenario: Applicable to leak detection of liquefied gas cylinders.
- Compatible Models (minor adjustments required or partial precision sacrificed):
MQ-6(Liquefied Petroleum Gas Sensor)- Heating Method: 5V constant heating, heating resistance 31Ω±3Ω(compatible with 33Ω);
- Load resistance: 20kΩ is recommended (when precision requirements are relaxed, the 10kΩ resistor in the circuit can be used as an emergency alternative, but the sensitivity will decrease slightly);
- Pin Definition: Pins 2 and 5 are heating pins, and pins 1,3/4, and 6 are signal pins;
- Scenario: Applicable to the detection of butane and propane gases.
MQ-135(Air Pollution / Formaldehyde Sensor)- Heating Method: 5V constant heating, heating resistance 31Ω±3Ω(compatible with 33Ω);
- Load resistance: Recommended 10kΩ(consistent with circuit
R3= 10kΩ); - Pin Definition: Pins 2 and 5 are heating pins, and pins 1,3/4, and 6 are signal pins;
- Scenario: Applicable for the detection of formaldehyde and ammonia indoors.
- Incompatible Models (Use to Be Avoided)
MQ-7(Carbon Monoxide Sensor): Requires high-low temperature cyclic heating (5V heating for 1 minute + 1.4V maintenance for 5 minutes); the circuit has no timing control module and thus cannot be adapted.MQ-8(hydrogen sensor): It adopts pulse heating which requires a specific timing sequence, and the current circuit does not support this function.MQ-9(Combustible Gas / Carbon Monoxide Sensor): Requires periodic heating switching, and the circuit has no corresponding control logic.
When in use, please note the following:
- Accuracy Compromise Solution: If the load resistor does not match the value recommended in the manual (e. g.,
MQ-6uses 10kΩ instead of 20kΩ), the threshold can be compensated via the potentiometer (R5), but the error in quantitative detection may increase (±10%~20%). - Pin Verification: Ensure that the sensor's "heating pins are 2 and 5, and signal pins are 1,3/4,6"(for
MQ-3, the pin definition needs to be confirmed, as some models have different pin sequences). - Preheating treatment: Preheat the device for at least 24 hours before first use; otherwise, the initial output drift may lead to misjudgment.
Other notes include:
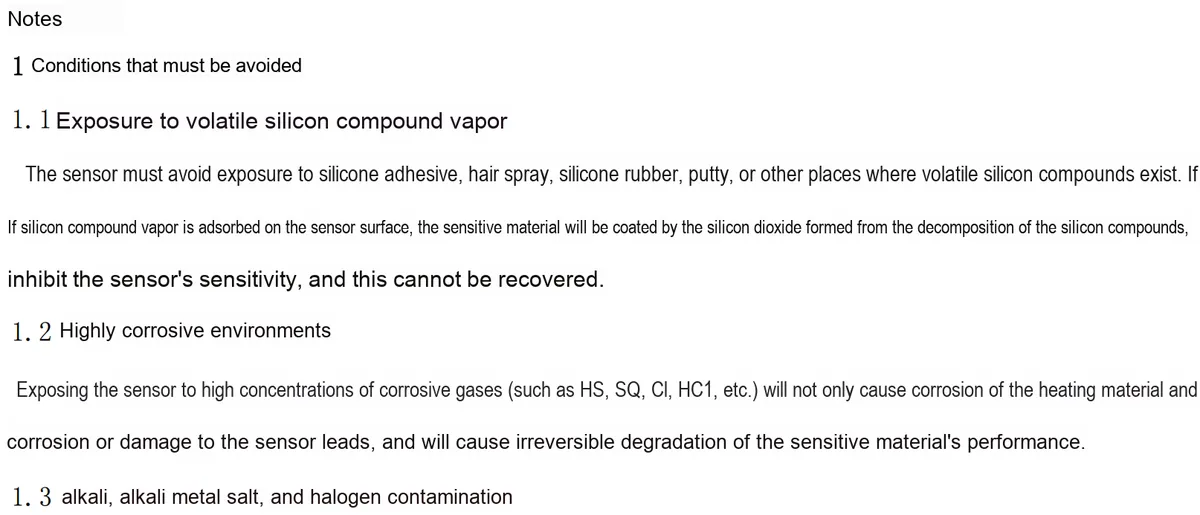
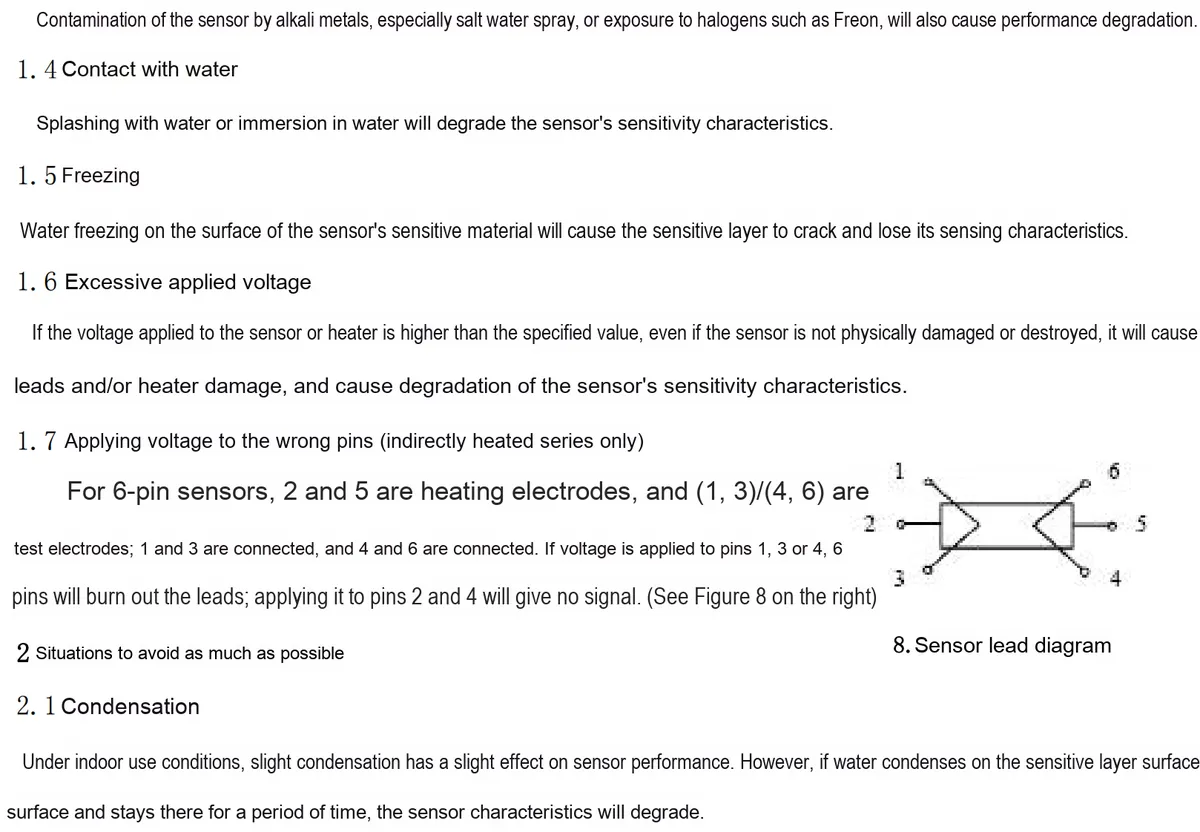
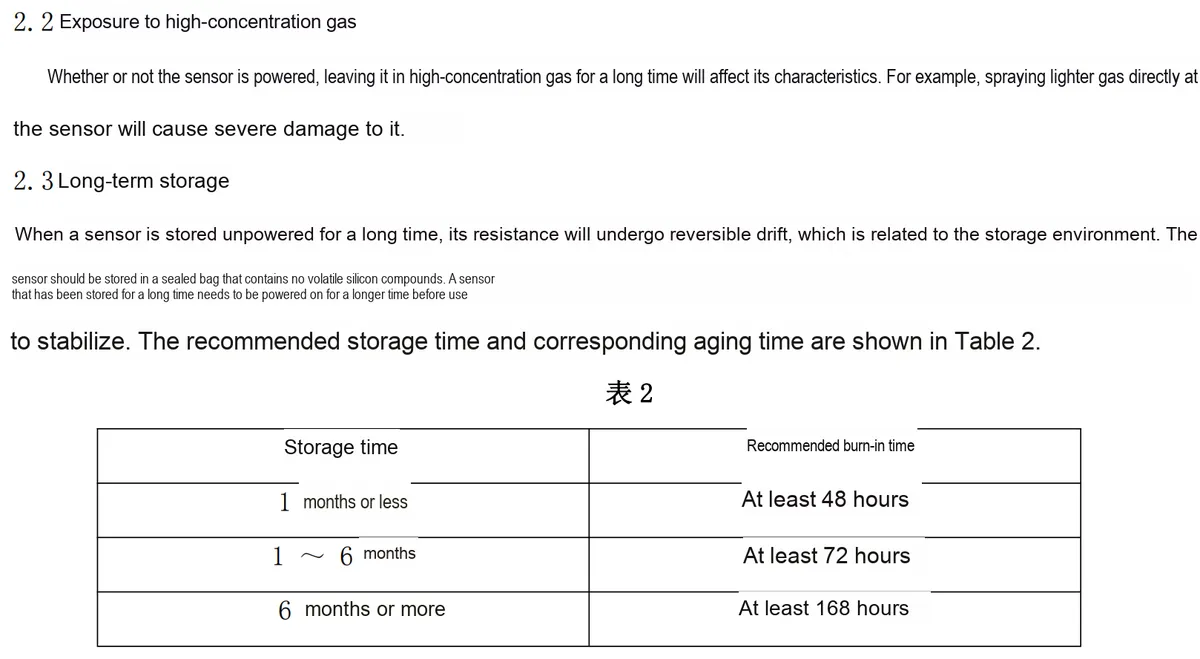
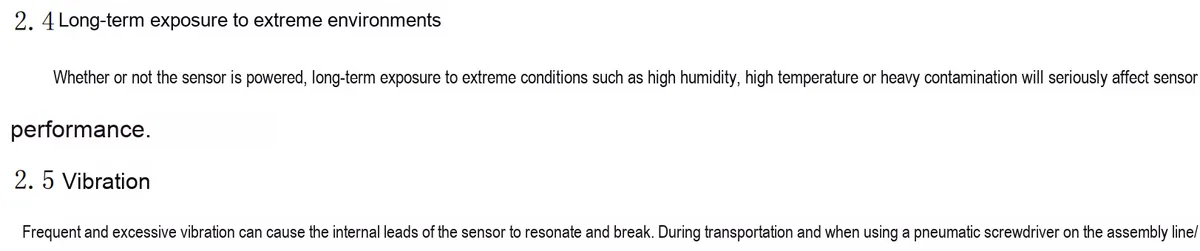
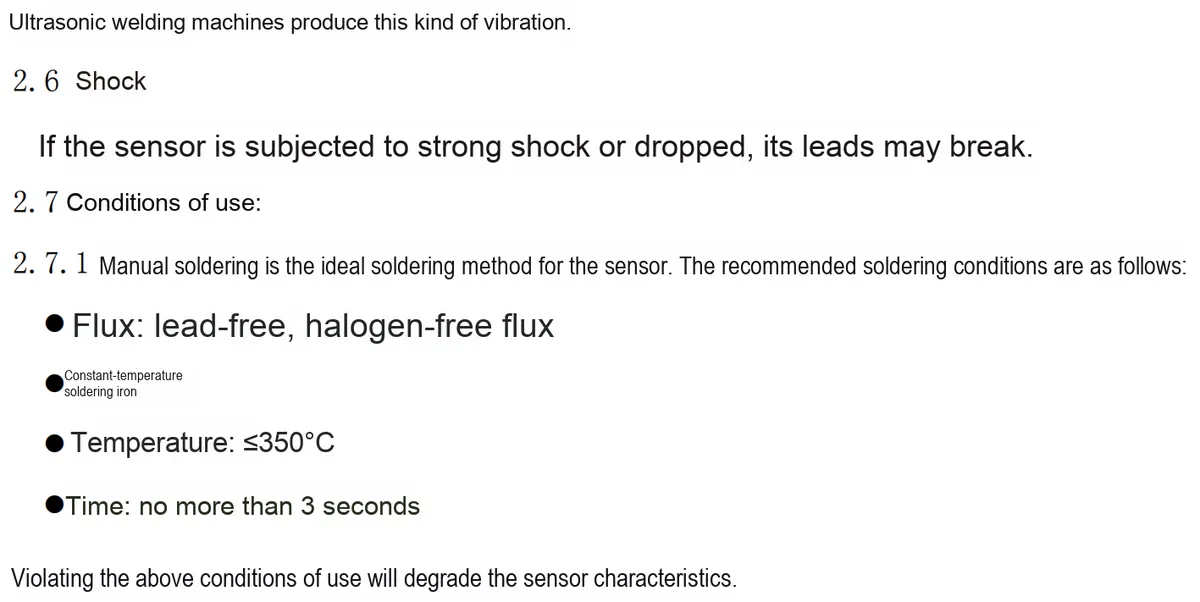
3.3 Application Experiment
Here, we use the GraftPort-RP2040 development board for testing, and connect the MQ series electrochemical gas sensor module to communicate with the main controller via the AIN interface.
Here, we first use the HY2.0-4P connection cable to connect the module to the GraftPort-RP2040 development board's AIN0 interface:
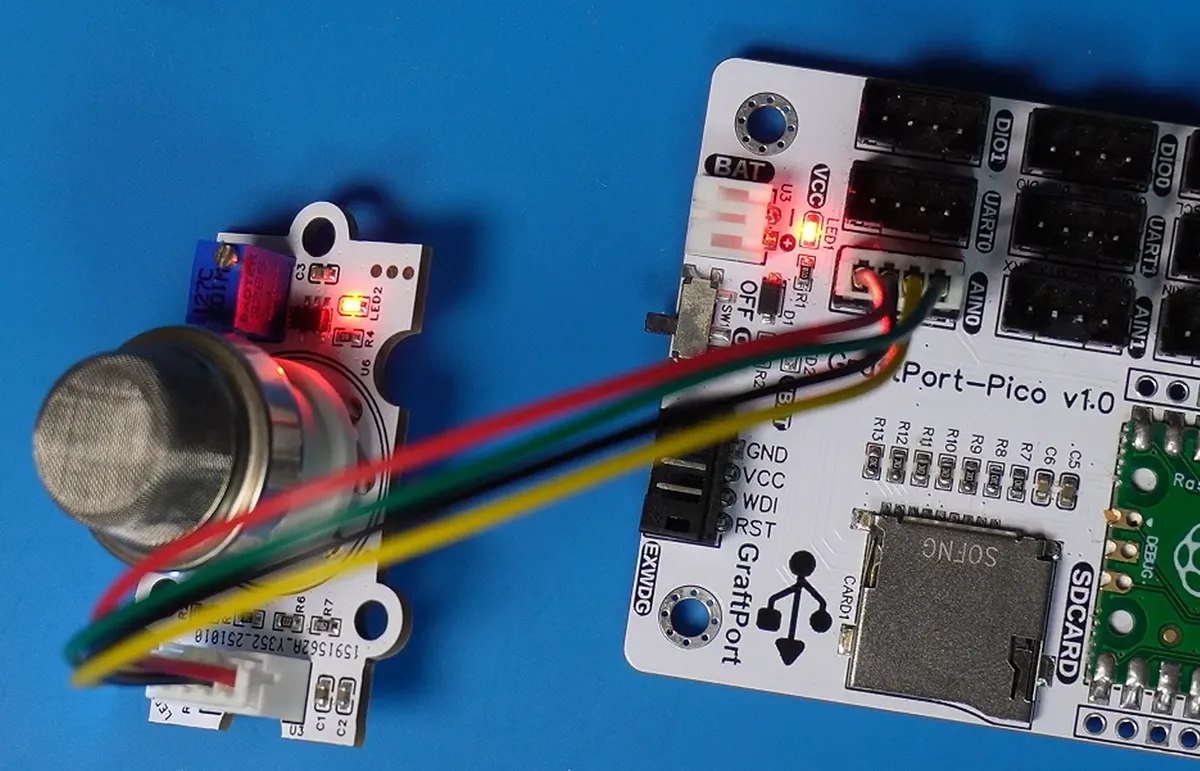
The module connections are shown in the following table:
development board pins | Module Pins | Description |
Pin 26 |
| Sensor analog signal input pin |
Pin 19 |
| Digital signal input pin after digital comparison of sensor analog signals |
Before burning the code, we first need to adjust the MQ series electrochemical gas sensor module the digital output threshold:
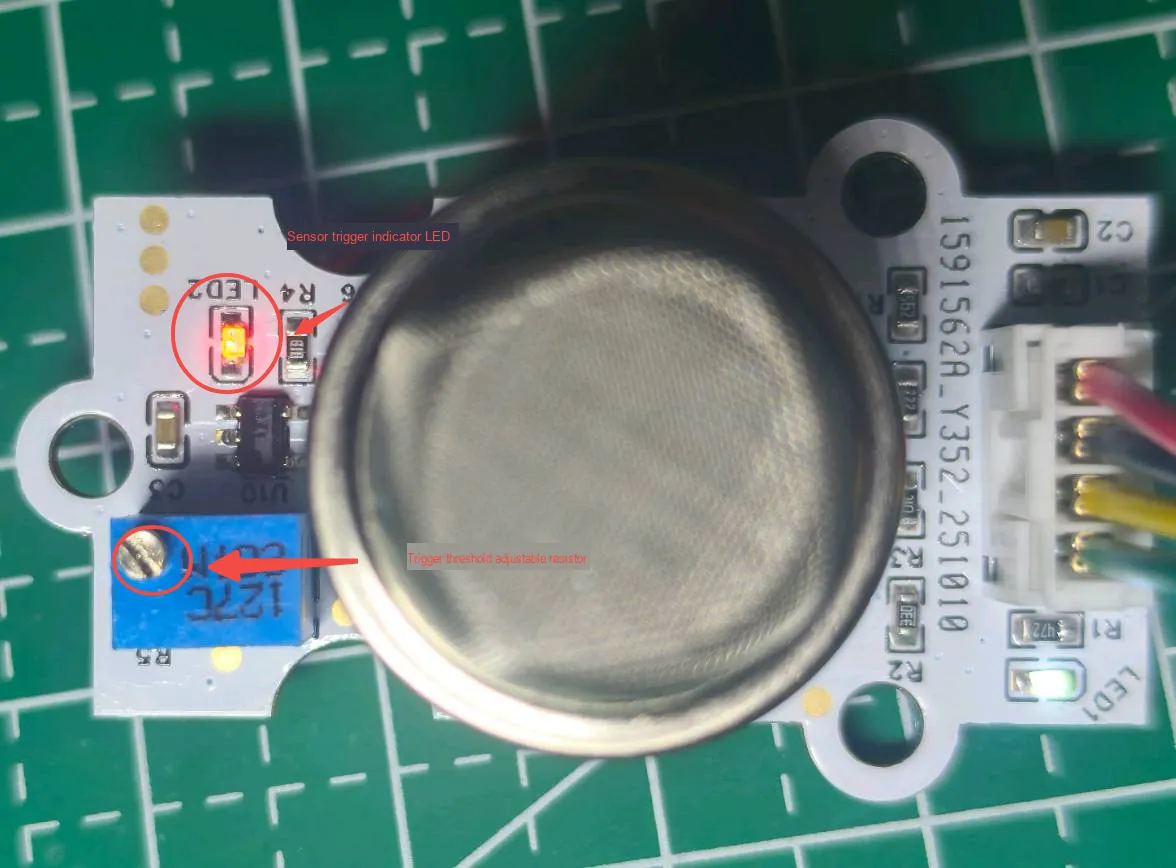
- Ensure the sensor is in normal air and has been fully warmed up, then locate the "threshold adjustment variable resistor
R5"(marked with a red circle in the figure) on the module; - Turn this counterclockwise while observing
LED2(sensor trigger indicator); - Stop the operation when
LED2is just fully lit, then slightly adjust it back to the position where it goes out; at this point, the sensor has been calibrated to a reasonable threshold in an air environment.
Here, we need to search for the relevant driver packages on uPyPI: https://upypi.net/zh/
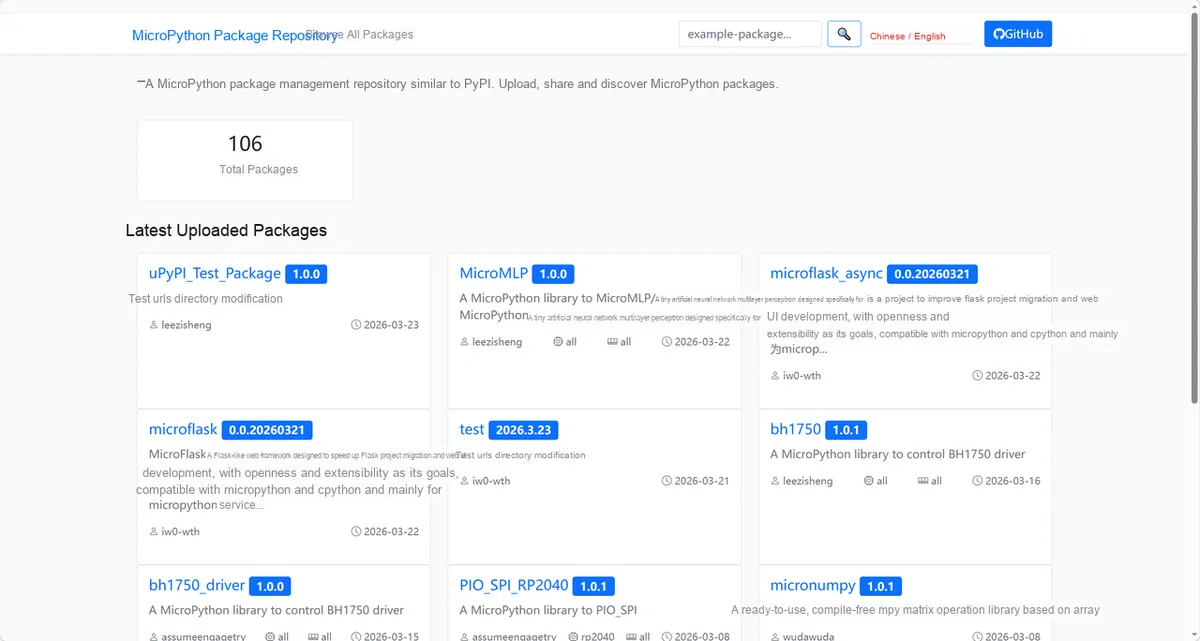
Enter mqx_driver to search, and the following will be displayed:

Click to copy the local installation command:
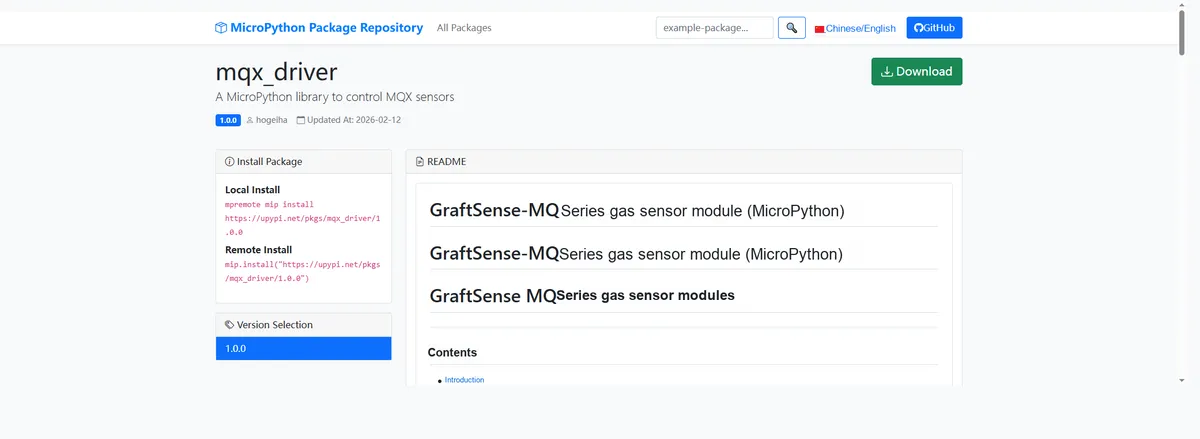
Here, we can import the module driver library code via the mip tool. Below are the usage commands for the mpremote tool:
mpremote mip install github:FreakStudioCN/GraftSense-Drivers-MicroPython/sensors/mqx_driverAfter importing the MQ series electrochemical gas sensor module - MicroPython driver code, copy the following main.py code into our project:
# Python env   : MicroPython v1.23.0
# -*- coding: utf-8 -*-
# @Time    : 2025/08/20 10:21
# @Author  : 缪贵成
# @File    : main.py
# @Description : Test the MQ series electrochemical sensor module driver

# ======================================== Import Modules =========================================

from machine import Pin, ADC
import time
from time import sleep
from mqx import MQX

# ======================================== Global Variables ============================================

# ======================================== Functions ============================================

# User callback function
def mq_callback(voltage: float) -> None:
    """
    Called when the comparator pin triggers an interrupt; prints the current voltage value.

    Args:
        voltage (float): Voltage value (unit: V).

    Returns:
        None: No return value.

    Raises:
        None: This function does not raise exceptions.

    ==========================================

    This function is called when the comparator pin triggers an IRQ,
    and prints the measured voltage.

    Args:
        voltage (float): Voltage value in volts.

    Returns:
        None: No return value.

    Raises:
        None: This function does not raise exceptions.
    """
    print("[IRQ] Voltage: {:.3f} V".format(voltage))

# ======================================== Custom Classes ============================================

# ======================================== Initialization ==========================================

# Power-on delay of 3 s
time.sleep(3)
# Print debug message
print("Measuring Gas Concentration with MQ Series Gas Sensor Modules")

# Pico ADC0 (GPIO26)
adc = ADC(Pin(26))
# Digital signal pin (GPIO19)
comp = Pin(19, Pin.IN)
mq = MQX(adc, comp, mq_callback, rl_ohm=10000, vref=3.3)

# Select a built-in polynomial (MQ2, MQ4, MQ7)
mq.select_builtin("MQ2")

# # Pass in a custom polynomial
# mq.set_custom_polynomial([1.0, -2.5, 3.3])

# ========================================  Main Program  ===========================================

print("===== MQ Sensor Test Program Started =====")
try:
    while True:
        # Read voltage
        v = mq.read_voltage()
        print("Voltage: {:.3f} V".format(v))

        # Read ppm (5 samples, 200 ms interval)
        ppm = mq.read_ppm(samples=5, delay_ms=200)
        print("Gas concentration: {:.2f} ppm".format(ppm))

        print("-" * 40)
        # Main loop interval
        sleep(2)
except KeyboardInterrupt:
    print("User interrupted, exiting program...")
finally:
    mq.deinit()
    print("Sensor resources released.")
To flash the code, open a terminal and use the mpremote tool to connect to the main controller; the output is as follows:
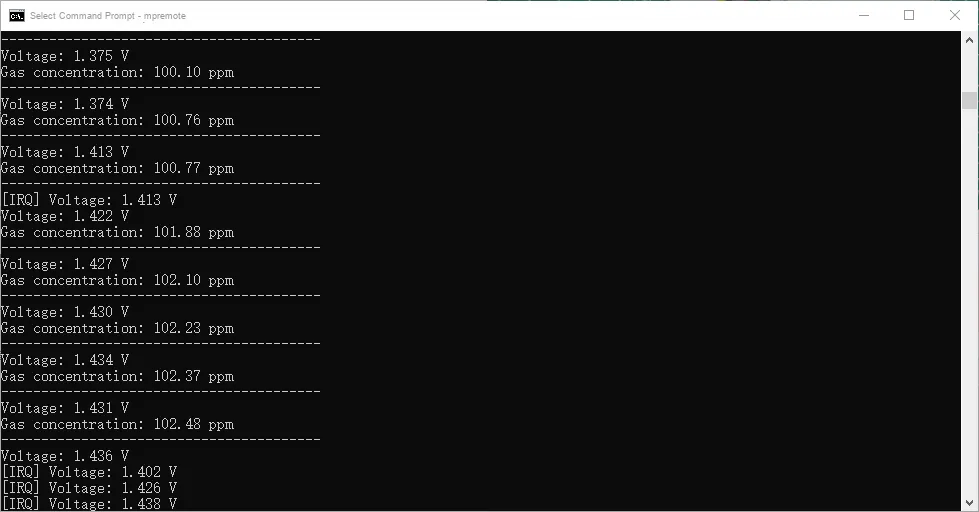
When no trigger occurs, it will print the pin voltage and gas concentration; when the sensor's trigger state changes (we use smoke spraying here), the callback function mg_callback will be invoked. In the example, when the callback function is triggered, the content [IRQ] will be printed, and at the same time LED2 (the sensor trigger indicator) will light up.
It should be noted here that our MQ series electrochemical gas sensor modules only support qualitative gas identification and cannot directly achieve quantitative detection (the coefficients in the code are simulated rather than real).
To achieve quantitative measurement capability, a professional calibration process is required: simulate different temperature and humidity environments by means of a high-low temperature alternating chamber, use standard calibration gas samples corresponding to the target gas, collect the analog voltage signals output by the sensor under various environmental conditions, and finally establish a correlation model of "temperature and humidity - gas concentration - output voltage" through curve fitting to complete the calibration for quantitative detection.
Here, we briefly explain the calibration concept for you. First, professional calibration equipment and consumables need to be prepared, and the core configurations include a high-low temperature alternating test chamber (used to simulate different temperature and humidity environments and eliminate the interference of environmental factors on sensor output), target gas standard samples with multiple gradient concentrations (which need to match the detection range of the sensor, such as combustible gas standard gas with a gradient of 0-1000ppm), and a gas test chamber (whose core function is to provide a sealed and uniform standard gas environment for the sensor probe to ensure the accuracy of calibration data).
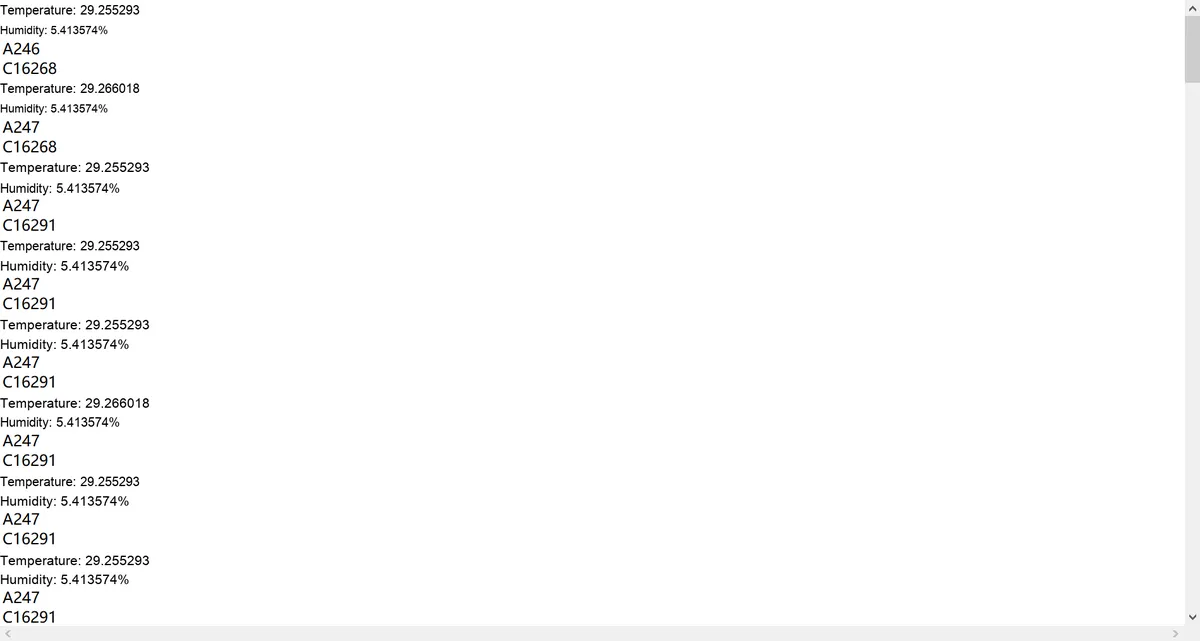
Next, on the embedded device side, collect the temperature value, humidity value, voltage output and the gas concentration value of the calibration gas near the probe, and save them to a file (it is required to collect as much data as possible under different temperature, humidity and gas concentration conditions after the probe is powered on in advance and fully preheated):
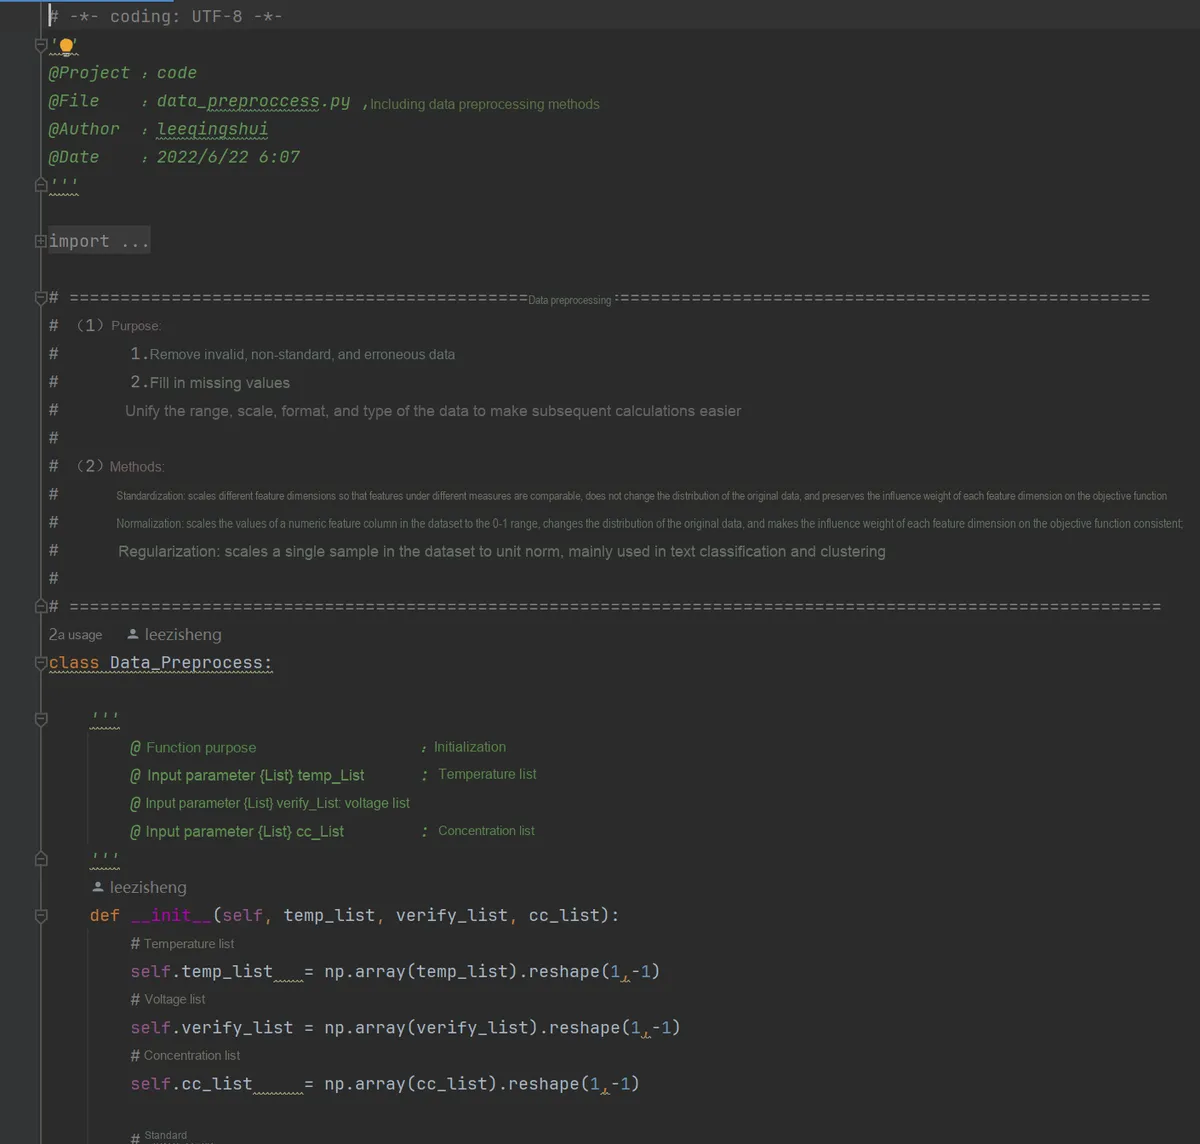
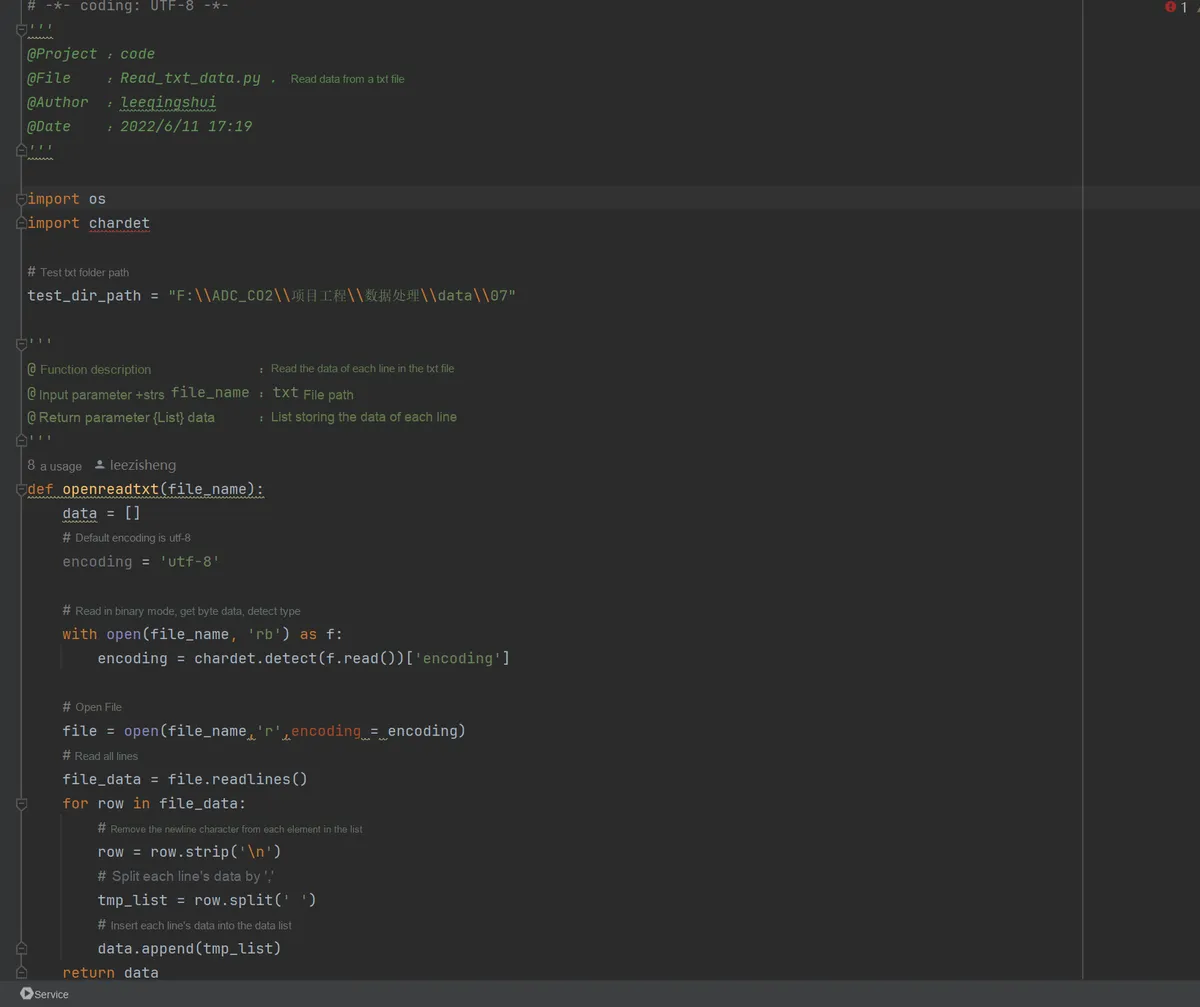
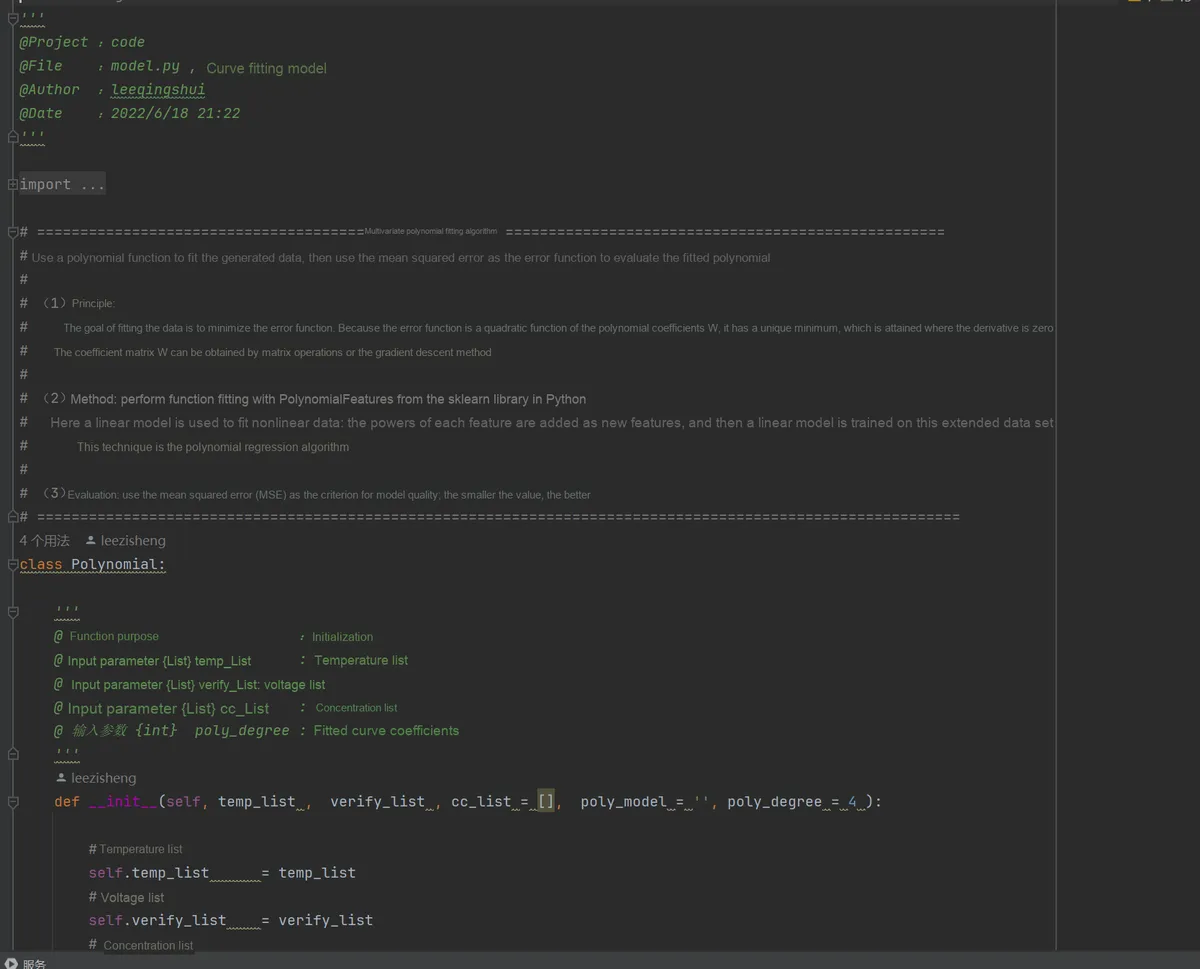
Then, on the PC side, you can use Python to write code for data fitting, which includes:
- Batch read multiple
TXTformatted raw sensor data files, automatically adapt to file encoding formats, filter blank lines, and convert text data into numerical format; - Perform cleaning preprocessing on the raw data, eliminate outliers with temperature and voltage beyond the measurement range, and fill in missing values with column mean to ensure the validity of the fitted data;
- Normalize the temperature and voltage features, scale the values to the range of 0 to 1, and eliminate the interference of dimensional differences between different features on the fitting results;
- call
sklearn'sPolynomialFeaturesto generate polynomial features (such as temperature², temperature × voltage, voltage², etc.), so as to realize the transformation of nonlinear data for linear fitting; - Split 80% of the data into the training set and 20% into the test set, and train the polynomial fitting parameters based on linear regression via Model Training;
- We take the mean squared error (
MSE) as the core evaluation metric to quantify the accuracy of the fitting model (the smaller the MSEvalue, the better the fitting effect); - Export the trained polynomial coefficients and intercept to provide core parameters for concentration calculation on the embedded device side;
- Visualize the fitted curve to intuitively compare the deviation between the actual concentration value of the sensor and the predicted value of the model, so as to assist in optimizing the polynomial order.
IV. Drivers
mqx_driver.zip 11 KB
5. BOM & Recommended Alternative Parts
None.
VI. Revision History
Document Version | Revision Date | Modifier | Revised Content |
v1.0 | 2025.8.13 | Miu Kwai-shing | Initialize Document |
v1.1 | 2025-09-17 | Li Zisheng | Added 2.8 PCB routing precautions Revised Section 3, Instructions for Circuit Source Project and Module Usage, and added a secondary heading: 3.1 Circuit Source Engineering, 3.2 Module Usage Instructions, 3.3 Application Experiments The BOM sheet has not been finally checked, the driver has not been re-verified, and the 3.3 application experiment Not yet specified. |
v1.2 | 2025-10-09 | Li Zisheng | Modify the document content according to the v1.3 circuit engineering The BOM sheet has not been finally checked, the driver has not been re-verified, and the 3.3 application experiment Not yet specified. |
v1.3 | 2025-10-09 | Li Zisheng | DIN and LED2 rules have been supplemented The BOM sheet has not been finally checked, the driver has not been re-verified, and the 3.3 application experiment Not yet specified. |
v1.4 | 2025-12-29 | Li Zisheng | Added application experiments and production files |
v1.5 | 2025-12-31 | Sin Ruili | Create an open version of the document based on the internal document version v1.4. |
v1.6 | 2025-01-28 | Li Zisheng | Photos of different MQ probes have been added. |
v1.7 | 2026-03-29 | Sin Ruili | Modified the application experiment section |
VII. Relevant Materials
7.1 Chip Datasheet
mq-2(ver1_6).pdf 556 KB
MQ-6 Gas Sensor Datasheet.pdf 213 KB
MQ-9B Carbon Monoxide Gas Sensor Datasheet.pdf 505 KB
MQ135 Air Pollution Detection Sensor Datasheet.pdf 546 KB
MQ3 Ethanol Sensor Datasheet.pdf 185 KB
MQ-4 Combustible Gas Sensor Datasheet.pdf 427 KB
7.2 Unique Icons for PCB Silk Screen