Contents
- I. Module Introduction
- II. Introduction to Main Chips
- 2.1 Chip Overview
- 2.2 Pin Definition
- 2.3 Functional Block Diagram
- 2.4 Performance Parameters
- 2.5 Reference Circuit
- 2.6 Chip Configuration
- 2.7 Communication Interfaces and Related Protocols
- 2.8 PCB Routing Notes
- 3. Instructions for Circuit Engineering and Module Usage
- 3.1 Circuit Source Engineering
- 3.2 Module Usage Instructions
- 3.3 Application Experiment
- IV. Drivers
- 5. BOM & Recommended Alternative Parts
- VI. Revision History
- VII. Relevant Materials
- 7.1 Chip Datasheet
- 7.2 Unique Icons for PCB Silk Screen
I. Module Introduction
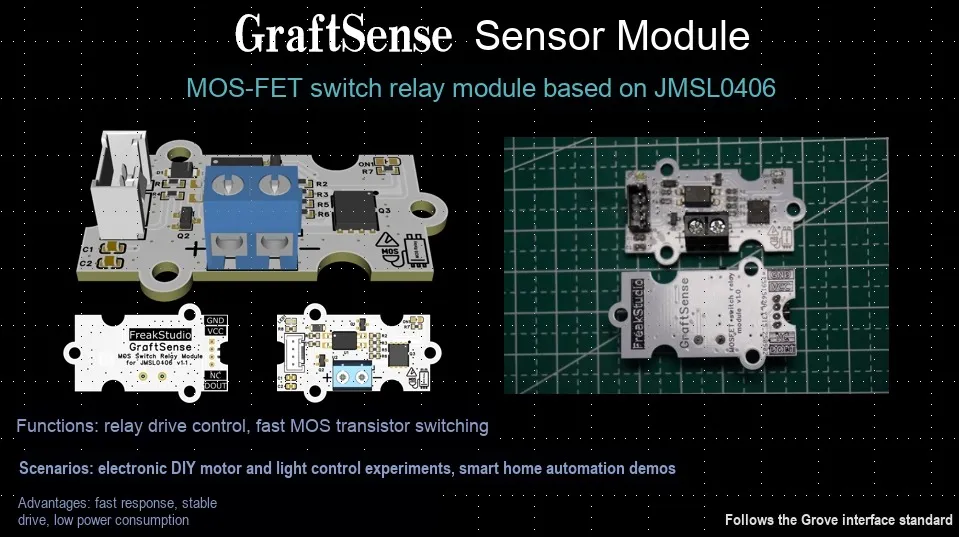
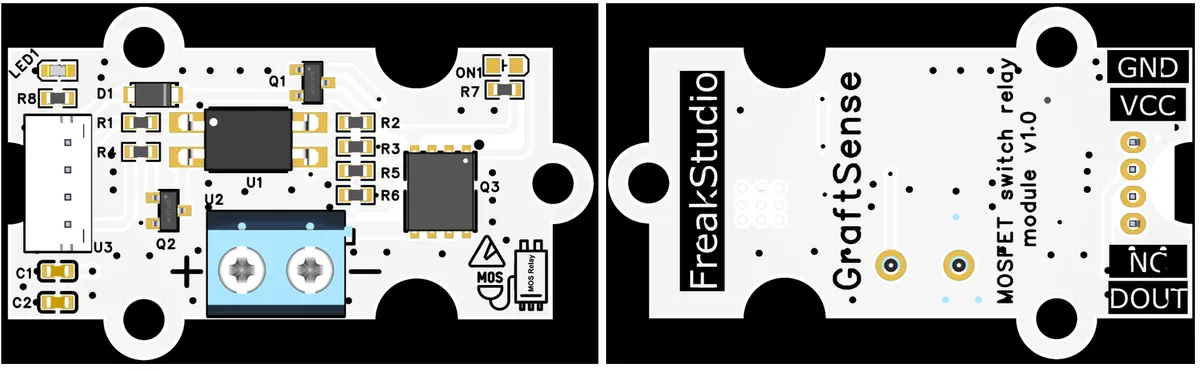
MOSFET Switch Relay Module Based on JMSL0406 takes JMSL0406AG (an N-channel power MOS transistor with 40V withstand voltage and 4.2mΩ low on-resistance) as the core switching device, and constructs an isolated drive circuit with matching PC817 optocoupler and SS8550 triode, with control signals input from the DOUT interface. The low on-resistance (4.2mΩ) of JMSL0406 reduces conduction loss, and its 40V withstand voltage adapts to common circuit scenarios;The module also integrates a sensor interface, GATE level indicator (for displaying driver status) and a power supply filtering circuit. Meanwhile, the PC817 optocoupler achieves electrical isolation between the control side and the power side, which not only ensures control safety but also endows the relay driver with the features of low loss and high reliability.
II. Introduction to Main Chips
This module mainly uses JMSL0406AG low-power MOS transistors and PC817 optocoupler isolation chips.
2.1 Chip Overview
2.1.1 JMSL0406AG Low-power MOS transistor
JMSL0406AG is an N-channel power MOSFET with a withstand voltage of 40V and a typical on-resistance of only 4.2mΩ, which belongs to low-loss power switching devices.
It features ultra-low RDS (ON), low gate charge, high current carrying capacity and other characteristics, and has also passed 100% UIS (unclamped inductive switching) test and Rg (gate resistance) test, delivering high reliability; its applicable scenarios include power management of computing devices, current switching of DC / DC and AC / DC subsystems, as well as load switches, fast wireless charging, motor drives, etc.
The device is packaged in PDFN5x6 , with pin configurations of 1-3 for source ( S ), 4 for gate ( G ), and 5-8 for drain ( D ). The multi-pin layout can improve current carrying and heat dissipation performance.

2.1.2 PC817 Optocoupler Isolation Chip
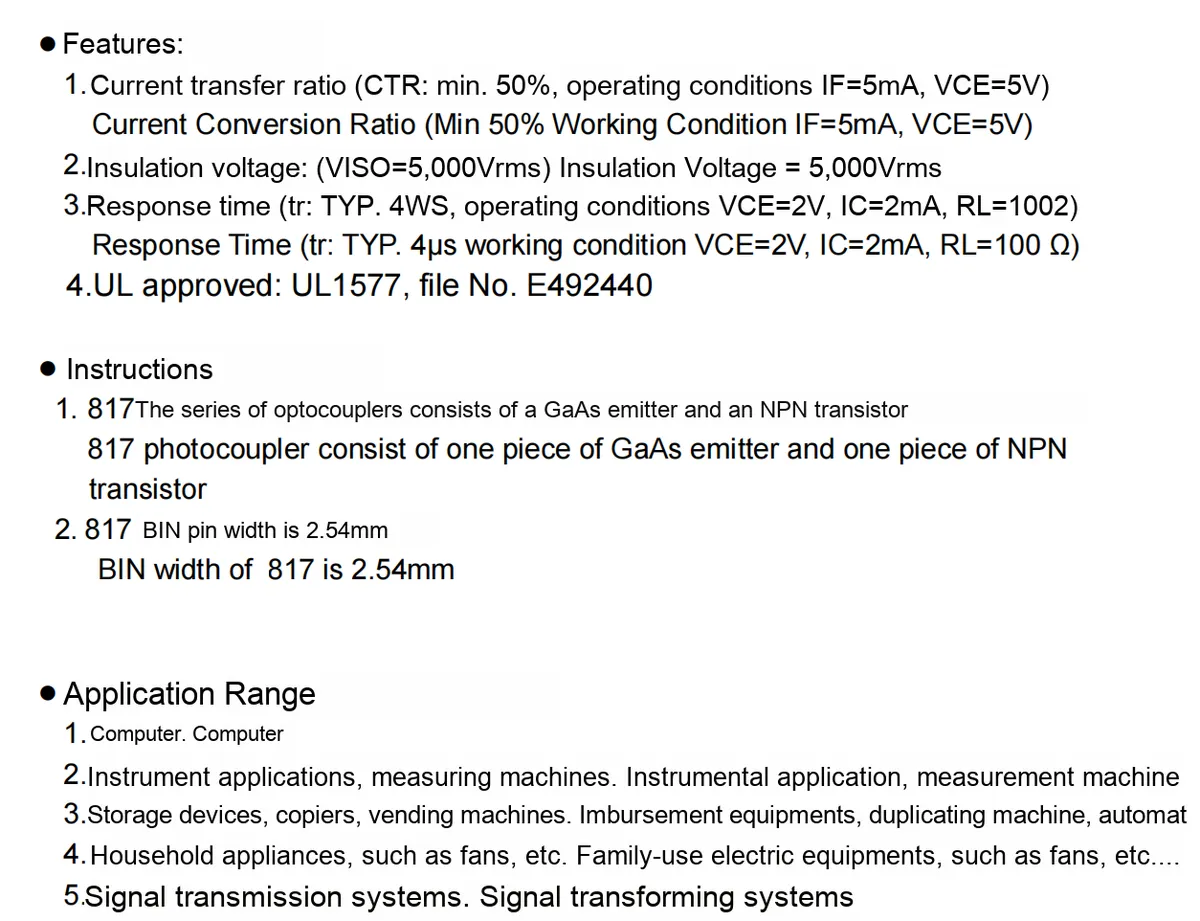
PC817 is a commonly used optocoupler, whose core consists of a GaAs light-emitting diode and an NPN phototransistor. It realizes electrical isolation between circuits through the "electricity-light-electricity" signal conversion (this is the core function of an optocoupler, which can isolate high and low voltages and suppress circuit interference).
2.2 Pin Definition
2.2.1 JMSL0406AG Low-power MOS FET
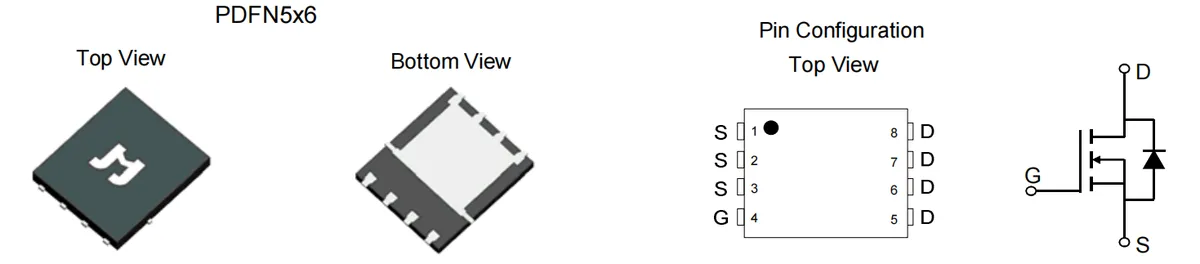
JMSL0406AG adopts the PDFN5x6 package. Viewed from the top perspective (including the black dot alignment mark), the function allocation of its 8 pins is as follows: pins 1,2 and 3 are all source terminals (S), pin 4 is the gate terminal (G), and pins 5,6, 7 and 8 are all drain terminals (D). This multi-pin layout (parallel connection of multiple S and D pins) is designed to reduce on-resistance and improve current carrying capacity and heat dissipation efficiency; meanwhile, this MOS transistor integrates a body diode from the drain terminal (D) to the source terminal (S), which corresponds to the parasitic diode structure between D and S in the schematic diagram on the right.
2.2.2 PC817 Optocoupler Isolation Chip
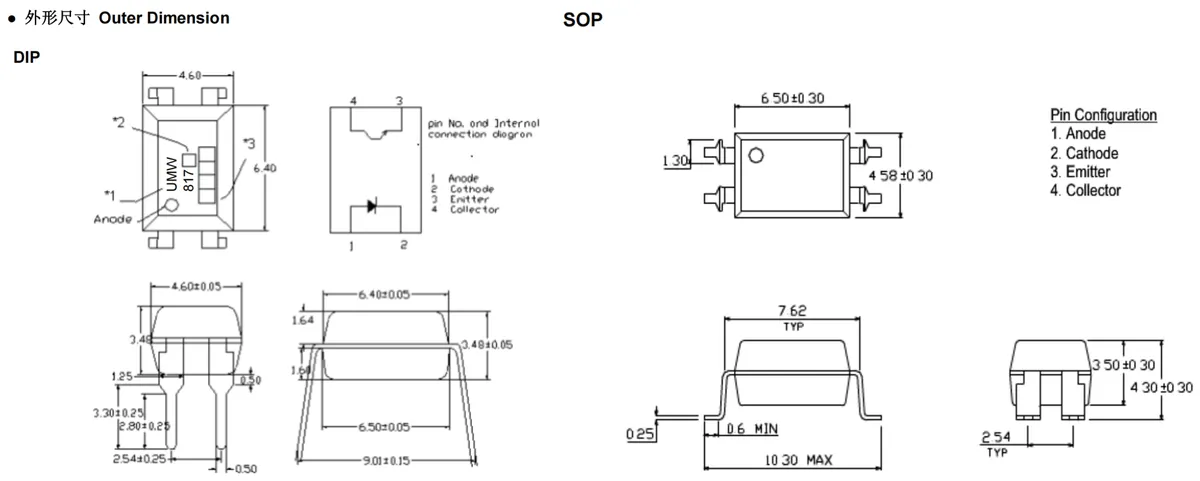
PC817 the pinout definition of the optocoupler is consistent across DIP and SOP packages, with a total of 4 pins, whose functions are as follows:
- Pin 1 (
Anode): The anode of the LED, connected to the high potential of the control terminal; - Pin 2 (
Cathode): The cathode of the LED, connected to the low potential of the control terminal; - Pin 3 (
Emitter): the emitter of the phototransistor, serving as the low-potential output terminal of the receiving end; - Pin 4 (
Collector): The collector of the phototransistor, serving as the high-potential output terminal of the receiving end.
In use, pins 1 and 2 are connected to a control signal (to drive the light-emitting diode to emit light), and pins 3 and 4 are connected to the load circuit (to receive the optical signal and convert it into an electrical signal for output), thereby achieving electrical isolation between the control end and the load end.
2.3 Functional Block Diagram
2.3.1 JMSL0406AG Low-power MOS transistor
None.
2.3.2 PC817 Optocoupler Isolation Chip
None.
2.4 Performance Parameters
2.4.1 JMSL0406AG Low-power MOS FET
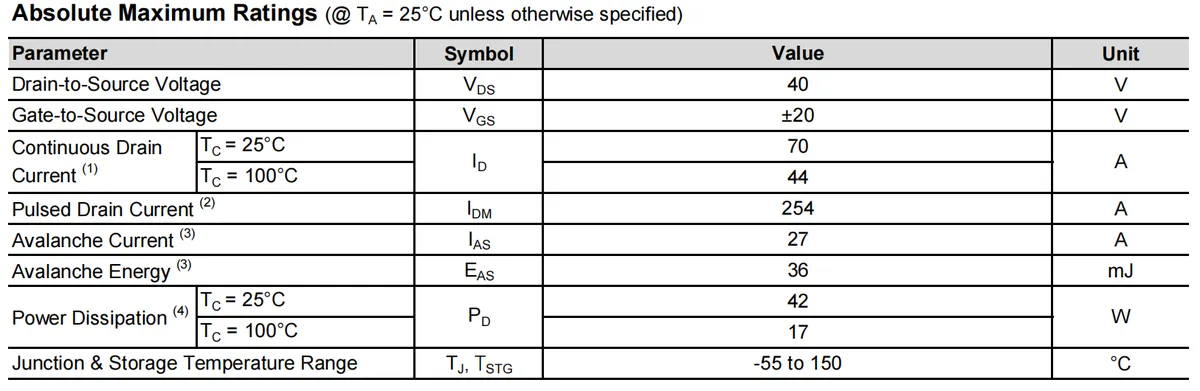
JMSL0406AG has the following absolute maximum ratings at room temperature (25°C)(exceeding these parameters will damage the device): the maximum drain-source voltage VDS is 40V, and the gate-source voltage VGS must be limited to within ±20V; the continuous drain current ID degrades as the case temperature (Tc) rises, reaching 70A at 25°C and dropping to 44A at 100°C, and the maximum drain current under short-pulse conditions IDM is 254A;Avalanche current for inductive loads IAS is 27A, avalanche energy EAS is 36mJ (ensuring reliability during inductive switching); power dissipation PD is also affected by case temperature, being 42W at 25℃ and 17W at 100℃; the Scope of Work for device junction temperature and storage temperature ranges from -55℃ to 150℃. These parameters define the extreme operating boundaries of the device and are safety thresholds that must be strictly adhered to in circuit design.
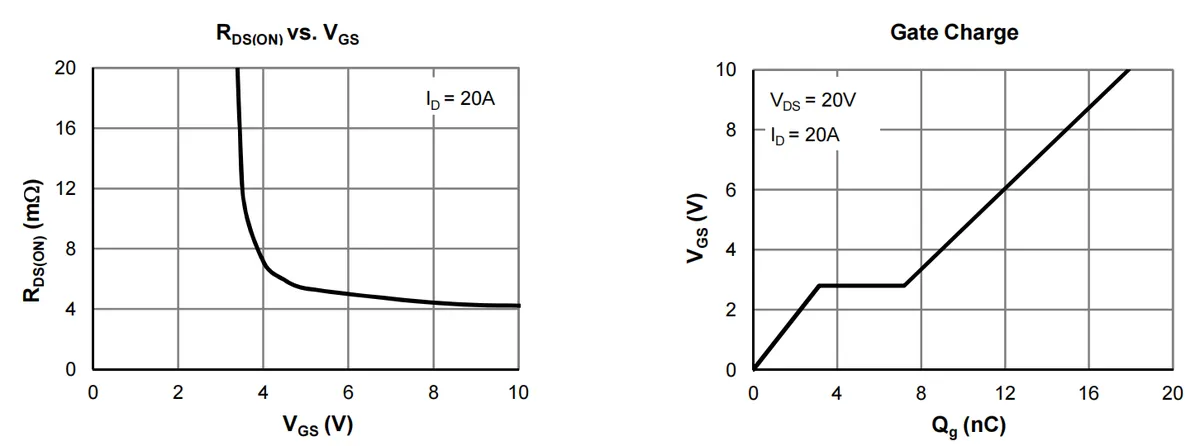
These two curves illustrate the core electrical characteristics of JMSL0406AG:
- RDS (ON) vs. VGS Curve (Test Condition:
ID= 20A): As the gate-source voltage (VGS) increases, the on-resistance (RDS (ON)) of the MOSFET drops rapidly. AfterVGSreaches approximately 4V,RDS (ON)gradually stabilizes at around 4 mΩ — this indicates that a sufficient gate drive voltage (typically ≥10V) enables the MOSFET to turn on fully, significantly reducing conduction losses. - Gate Charge Curve (Test Conditions:
VDS= 20V,ID= 20A): Reflects the relationship between gate charge (Qg) andVGS: In the initial stage ofQgincrease,VGSrises rapidly, then enters the "Miller Plateau"(VGSremains stable) — during this phase, theMOStransistor completes the switching from cut-off to turn-on; after that,Qgcontinues to increase andVGSrises again. The magnitude of gate charge determines the switching speed of theMOStransistor: the smaller theQg, the faster the switching process and the lower the switching loss.
These two curves collectively guide the driving design of this MOS transistor: a sufficient VGS must be provided to reduce the on-resistance, while the load-bearing capability of the gate drive circuit must be matched to optimize the switching characteristics.
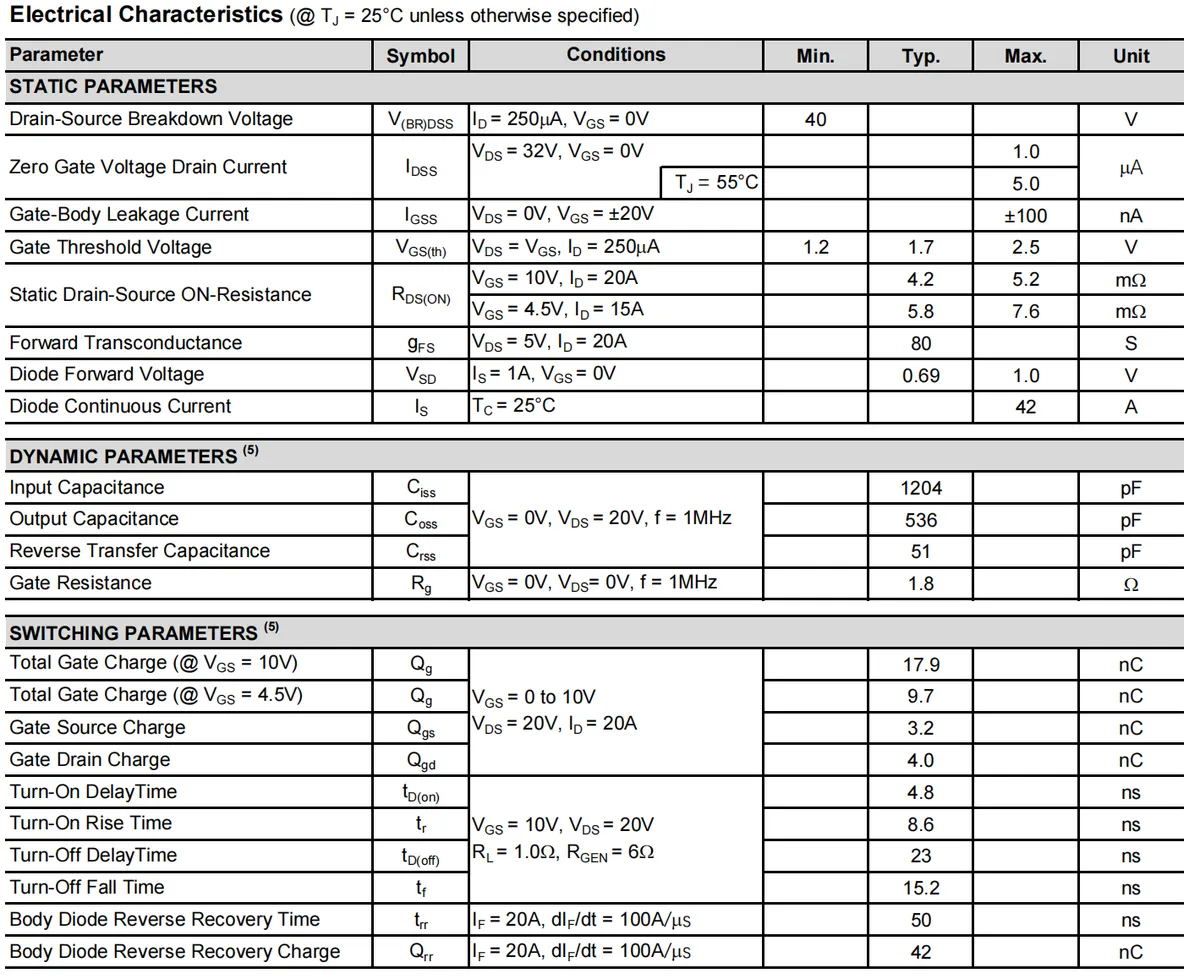
This table presents JMSL0406AG the key parameters of its electrical characteristics at 25°C, and their core significance can be understood in combination with the basic principles of MOSFETs:
- Among the static parameters:
- Drain-source breakdown voltage
V_{(BR) DSS}(40V) is the upper limit of the voltage at which the drain and source terminals will not break down; - Gate Threshold Voltage
VGS (th)(1.2~2.5V, typically 1.7V) isMOSthe minimum gate-source voltage at which the transistor starts to turn on; - On-resistance
RDS (ON)(VGS= 10V, typical value 4.2mΩ) is its core advantage, and the low resistance can significantly reduce conduction loss; - Body diode forward voltage
Vsd(typical value 0.69V) corresponds toMOStube freewheeling voltage drop of the parasitic diode.
- Drain-source breakdown voltage
- In the dynamic parameters:
- Input/output/reverse transfer capacitance (
Css/Coss/Crss) is a parasitic capacitance that determines the high-frequency operating characteristics ofMOStransistors; - Gate resistance
Rg(typically 1.8Ω) affects the transmission speed of switching signals.
- Input/output/reverse transfer capacitance (
- Among the switch parameters:
- Total gate charge
Qg(VGS= 10V, 17.9 nC) determines the charge required to drive theMOStransistor to switch; the smallerQgis, the lower the switching loss. - The switching parameters (e. g., turn-on delay of 4.8ns, rise time of 8.6ns) demonstrate its nanosecond-level fast response capability, making it suitable for high-frequency switching scenarios;
- Body diode reverse recovery time
tr(typically 50 ns) affects the performance of the freewheeling process under inductive loads.
- Total gate charge
Together, these parameters define the voltage endurance, conduction capability, high-frequency characteristics and switching performance of this MOS FET, and serve as the core basis for matching drivers and loads in circuit design.
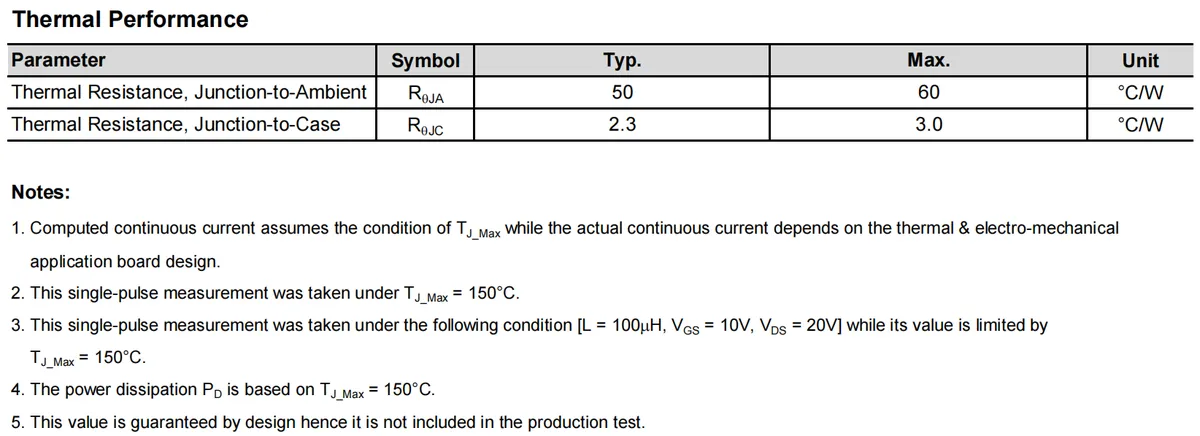
Thermal resistance is an indicator for measuring the heat dissipation capability of a device (unit: ℃/W, which represents the temperature rise of the corresponding region when 1 W of power is consumed):
- Junction-to-Ambient Thermal Resistance (
RθJA): typically 50℃/W, maximum 60℃/W, which refers to the heat dissipation resistance from the core junction region of aMOSFET to the surrounding air — a higher value indicates that when relying solely on natural air cooling, the junction temperature will rise rapidly with power consumption (for example, 1W of power consumption will make the junction temperature 50~60℃ higher than the ambient temperature). - Junction-to-case thermal resistance (
RθJC): typically 2.3℃/W, maximum 3.0℃/W, which refers to the thermal resistance from the junction region to the device package case — this low value indicates that the case can efficiently dissipate heat from the junction; in practical applications, attaching a heat sink to the case can significantly reduce the junction temperature and increase the actual power handling capability of the device.
These parameters serve as the core basis for the thermal design of circuits (the maximum allowable power dissipation shall be calculated via thermal resistance in combination with the junction temperature upper limit of 150°C), and also explain why the actual continuous current of a device is affected by the heat dissipation design.
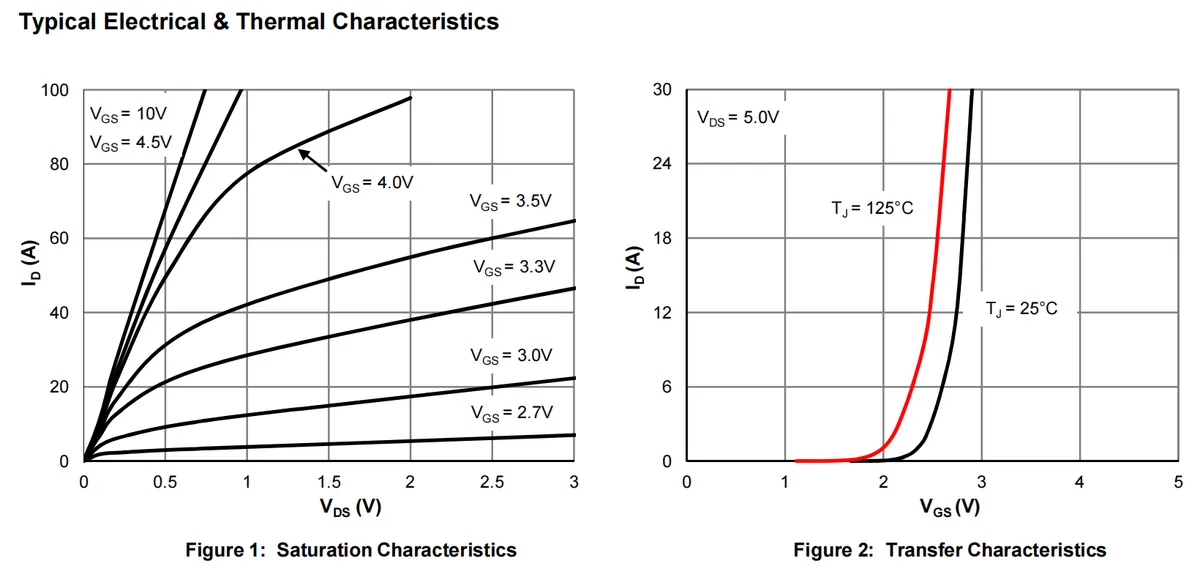
These two curves illustrate the core electrical characteristics of JMSL0406AG, and their implications can be understood in combination with the basic principles of MOS transistors:
- Saturation characteristic curve (Figure 1) : It is the relationship between the drain current (
ID) and the drain-source voltage (VDS) under different gate-source voltages (VGS). The curve reflects: the higher theVGS, the larger the correspondingIDof the sameVDS(such asIDclose to 100A whenVGS = 10V);WhenVDSexceeds a certain value,IDenters the "saturation region"(no longer rises significantly asVDSincreases) — this aligns with the principle of N-channelMOStransistors that "the higher the VGS, the stronger the channel conductivity", and also clarifies the current carrying capacity under different gate drive voltages. - Transfer characteristic curve (Figure 2): Under a fixed drain-source voltage (
VDS= 5V), it depicts the relationship betweenIDandVGS, comparing two junction temperatures (Tj): 25°C and 125°C. The curve shows that the higher the junction temperature (125°C), the larger theVGS-correspondingID(this is a result of the temperature-dependent carrier characteristics ofMOStransistors); whenVGSexceeds the gate threshold voltage,IDrises rapidly — this reflects the switching characteristic ofMOStransistors that "gate voltage controls drain current", and also demonstrates the effect of temperature on conduction capability.
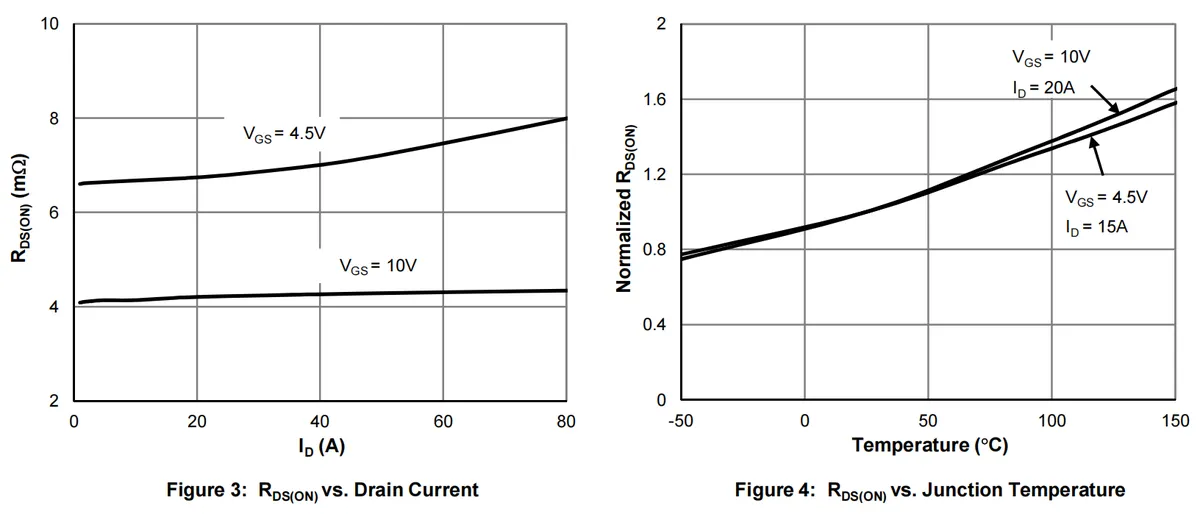
These two curves illustrate that JMSL0406AG 's on-resistance (RDS (ON)) is affected by drain current and junction temperature, and its characteristics can be understood in combination with the conduction principle of MOS transistors:
- Figure 3 (RDS (ON) vs. Drain Current ID) compares the scenarios when
VGS= 4.5 V and 10 V — whenVGS= 10 V, asIDrises from 0 to 80 A,RDS (ON)remains basically stable at around 4 mΩ(the channel is fully turned on, so current has little impact on on-resistance); whenVGS= 4.5 V,RDS (ON)increases significantly asIDgrows (insufficient gate drive voltage means the channel is not fully turned on, and rising current further aggravates the increase of on-resistance).This reflects that "sufficient gate drive voltage is the key to maintaining lowRDS (ON)". - Figure 4 (RDS (ON) vs. Junction Temperature Tj): Presented as normalized ratios, the higher the junction temperature,
the greater RDS (ON)becomes (the resistivity of semiconductor materials increases with rising temperature, leading to higher channel resistance); additionally, atVGS= 4.5V, the increase amplitude ofRDS (ON)with temperature rise is more pronounced than that atVGS= 10V(when drive is insufficient, temperature exerts a more significant impact on conduction characteristics).
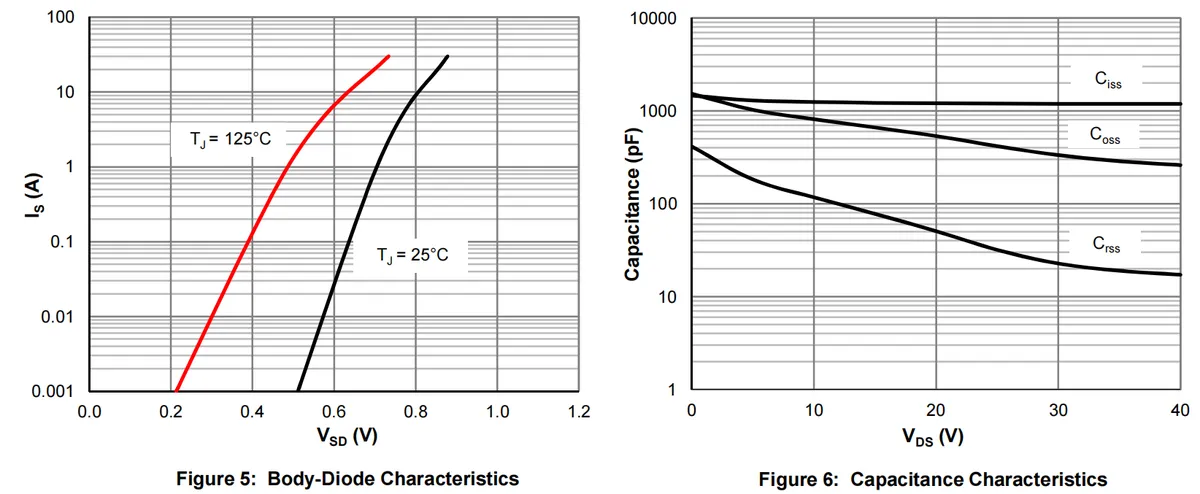
These two curves illustrate the body diode characteristics and parasitic capacitance characteristics of JMSL0406AG, and its function can be understood in combination with the structural principle of MOS transistors:
- Figure 5 (Body Diode Characteristics): Illustrates the forward characteristics of the parasitic
MOSFET drain-sourcePNjunction diode, and compares the relationship between forward current (Is) and forward voltage (VSD) at junction temperatures of 25°C and 125°C.The forward conduction voltage of a PNjunction decreases as temperature rises, therefore at 125°C, the Is corresponding to the sameVSDis much larger than that at 25°C; whenVSDexceeds the conduction threshold of approximately 0.2V,Isrises rapidly — this characteristic determines the current carrying capability of MOSFETs in freewheeling scenarios with inductive loads. - Figure 6 (Capacitance Characteristics): illustrates
MOStransistor's parasitic capacitances (input capacitanceCiss, output capacitanceCoss, reverse transfer capacitanceCrss) as a function of drain-source voltage (VDS):As VDSincreases, the depletion layer near the drain widens, and the equivalent plate spacing of the parasitic capacitances increases, so all capacitances gradually decrease. These parasitic capacitances are the core source of switching loss inMOStransistors (capacitor charging and discharging requires time and energy), and their magnitude directly affects the high-frequency switching performance of the device.
These two curves respectively clarify MOS the characteristics of parasitic elements (body diode, parasitic capacitance) of the transistor, and serve as the key reference for designing freewheeling circuits and high-frequency switching circuits.
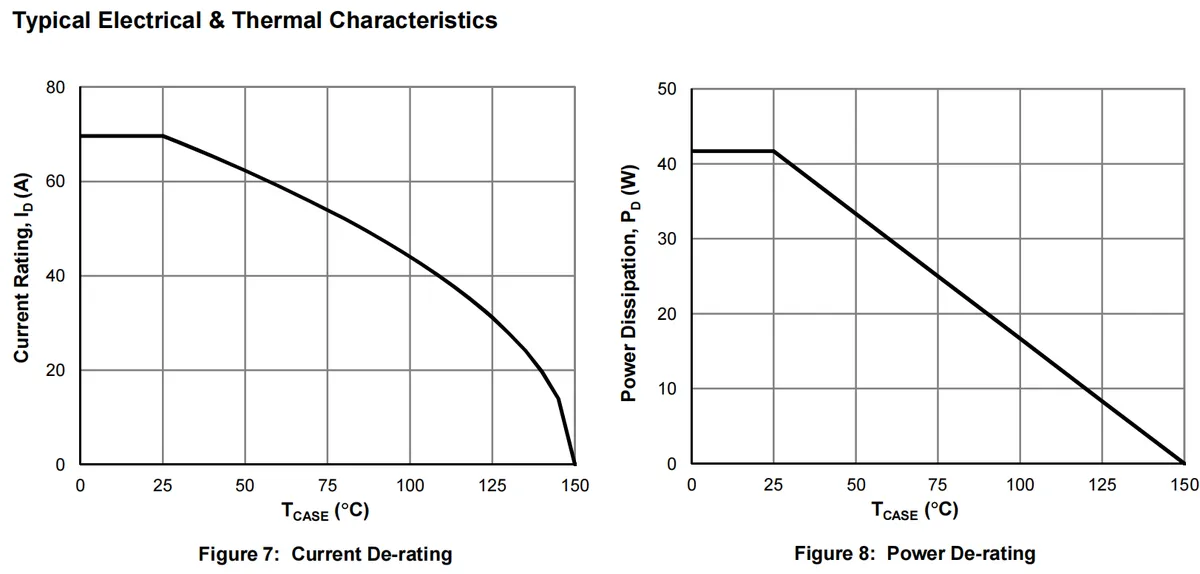
These two curves illustrate JMSL0406AG 's "derating characteristics"(i. e., the rated capability of the device decreases as temperature rises), and its core function can be understood in combination with the basics of thermal design:
- Figure 7 (Current Derating Curve): The horizontal axis represents the device case temperature (
TCase), and the vertical axis represents the drain current rating (ID). The curve shows that when the case temperature is low (e. g., 25°C), the current rating remains at approximately 70A (corresponding to the absolute maximum rating); as the case temperature rises, the current rating gradually decreases, dropping to 0 at 150°C — this is because elevated temperature increases the thermal stress on the device, and to prevent the junction temperature from exceeding the upper limit of 150°C, the operating current must be reduced, which directly reflects the rule that "the higher the temperature, the weaker the current-carrying capability of the device". - Figure 8 (Power Derating Curve): The horizontal axis represents the case temperature (
TCase), and the vertical axis represents the power dissipation rating (PD). The curve shows that when the case temperature is low, the power dissipation rating remains at approximately 42 W; as the case temperature rises, the power dissipation decreases linearly, dropping to 0 at 150°C — this is because power dissipation is converted into heat: the higher the temperature, the poorer the heat dissipation capability of the device, and the allowable power consumption must be reduced accordingly, otherwise the junction temperature will exceed the specified limit.
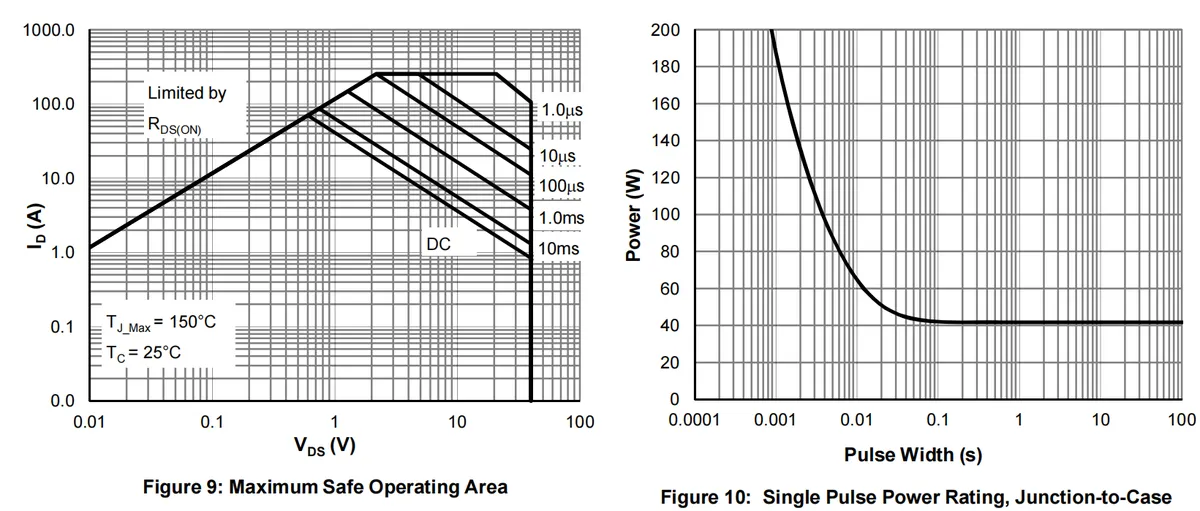
These two curves illustrate JMSL0406AG 's safe operation and pulse power characteristics. Combined with the heat accumulation and maximum operating principle of MOS FETs, its core value can be understood as follows:
- Figure 9 (Safe Operating Area
SOA): refers to the safe combination range of drain-source voltage (VDS) and drain current (ID), under the conditions of different pulse widths (1.0μs to DC) and a maximum junction temperature of 150°C. The curve shows that the narrower the pulse width, the wider the allowableVDS-IDcombination (heat does not fully accumulate under short pulses, so higher instantaneous power can be withstood);The region corresponding to direct current (DC) is the safe range for long-term operation, and the annotation"Limited by RDS (ON)"indicates that the safety boundary of the lowVDSregion is determined by the on-resistance (to avoid excessive conduction loss).SOAis the core basis for selecting the operating point ofMOStubes in circuit design, and it is necessary to ensure that the actualVDSandIDalways stay within the region corresponding to the working condition. - Figure 10 (Single Pulse Power Rating): illustrates the relationship between pulse width and allowable pulse power. The narrower the pulse width, the higher the allowable power (less instantaneous heat accumulation, so the junction temperature will not exceed the limit); when the pulse width exceeds approximately 0.1 seconds, the power rating stabilizes at around 40W (consistent with the DC power dissipation rating, as the heat accumulation effect at this point is equivalent to long-term operation).
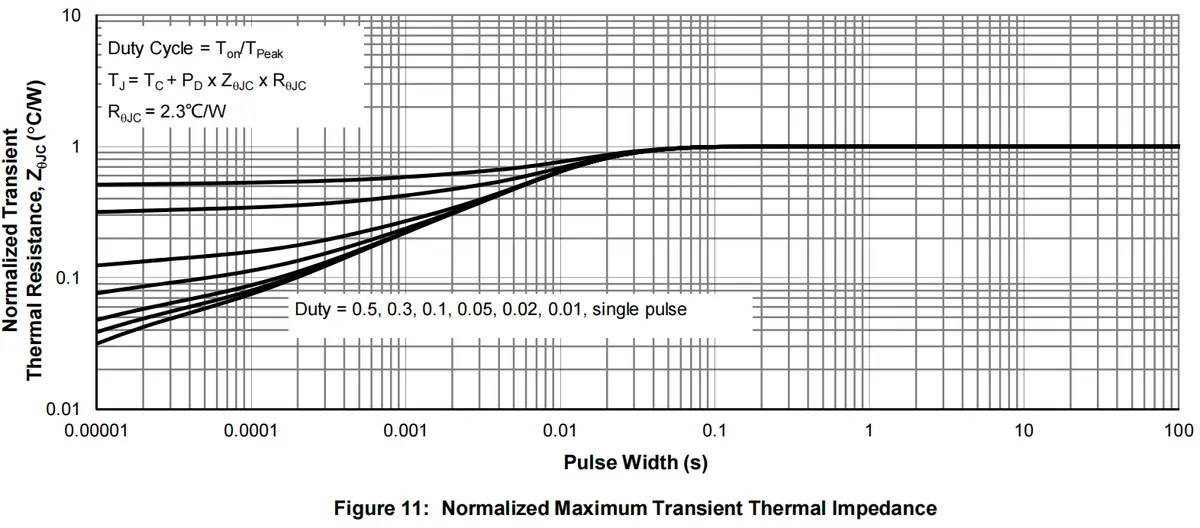
This Figure 11 illustrates JMSL0406AG 's normalized transient thermal impedance characteristics, whose core function can be understood in combination with the "time accumulation effect" of heat transfer:
Transient thermal impedance (ZθJC) is a parameter that describes "the variation of the thermal resistance from the device junction to the case with time (pulse width) under pulsed thermal load"(which differs from the "long-term thermal equilibrium" state of steady-state thermal resistance). The horizontal axis of the figure represents pulse width, the vertical axis represents the normalized transient thermal impedance (based on the steady-state junction-to-case thermal resistance RθJC), and the curves correspond to different duty cycles (Duty Cycle) and single-pulse operating conditions:
- The narrower the pulse width, the less time the heat has to fully transfer from the junction region to the package, and the smaller the normalized transient thermal impedance (i. e., lower thermal resistance, leading to a slower rise in junction temperature);
- When the pulse width is sufficiently large (>1 s), heat transfer reaches a steady state, and the normalized thermal impedance stabilizes at 1 (consistent with the steady-state thermal resistance
RθJC= 2.3 °C/W); - The smaller the duty cycle (i. e., the lower the proportion of the on-time in a cycle), the weaker the heat accumulation, and the lower the transient thermal impedance under the same pulse width.
2.4.2 PC817 Optocoupler Isolation Chip
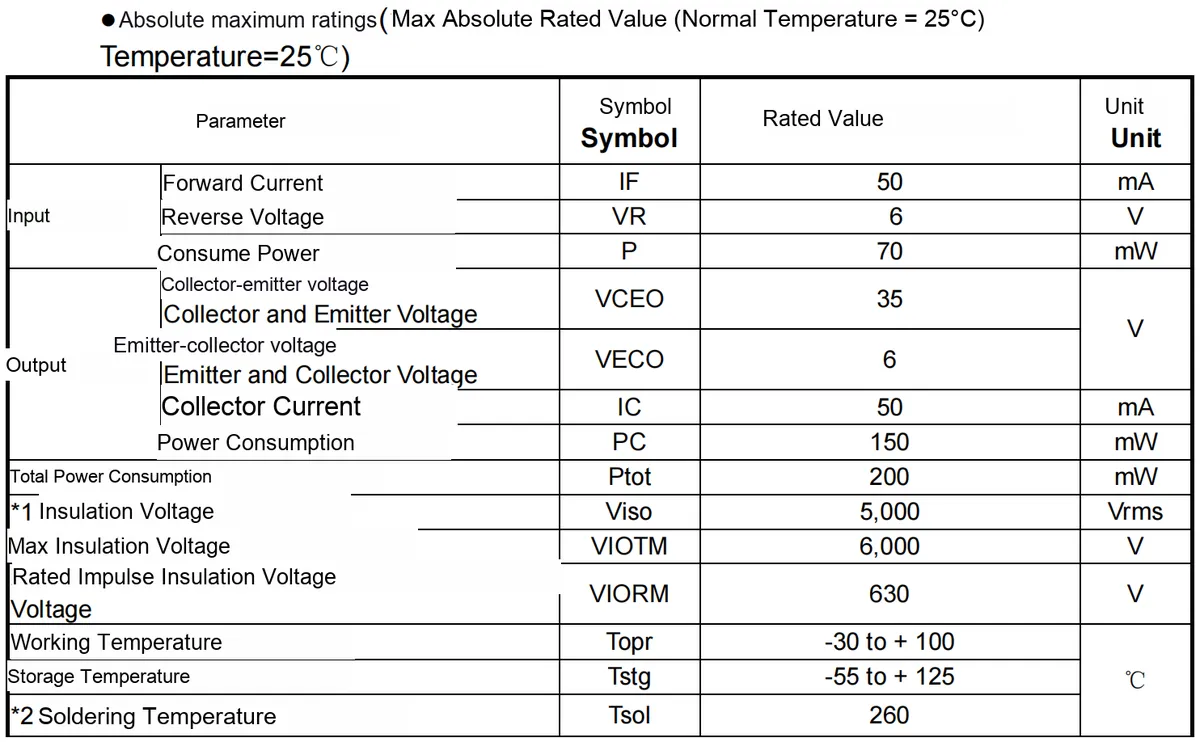
This table presents PC817 the maximum absolute ratings of the optocoupler at room temperature (25℃), and each parameter should be understood in combination with its structure of "light-emitting diode (input) + phototransistor (output)":
- Input terminal (light-emitting diode) parameters: Forward current
IF(50mA) is the maximum forward current that the light-emitting diode can withstand, and exceeding this value will burn out the diode; reverse voltageVR(6V) is the maximum reverse voltage that the light-emitting diode can tolerate; power dissipationP(70mW) is the upper limit of the maximum power dissipation of the light-emitting diode. - Output (Phototransistor) Parameters: Collector-Emitter Voltage
VCEO (35V), Emitter-Collector VoltageVECO (6V)are the withstand voltage limits for different polarities across the transistor; Collector CurrentIC(50mA) is the maximum current that can be output from the transistor's collector; Power DissipationPC(150mW) is the maximum power dissipation of the transistor. - General and Insulation Parameters: Total power consumption
Ptot(200mW) is the upper power consumption limit of the entire optocoupler; the isolation voltageViso(5000Vrms) refers to the electrical isolation voltage between the input and output terminals (for safety assurance), and there are also restrictions on the transient maximum isolation voltage (6000V) and impulse isolation voltage (630V). - Temperature Parameters: Operating temperature
Topr(-30 to + 100°C) refers to the temperature range for normal operation of the optocoupler; storage temperatureTstg(-55 to + 125°C) refers to the temperature range for storage; soldering temperatureTsol(260°C) refers to the upper temperature limit during soldering (to avoid chip damage caused by high temperature).
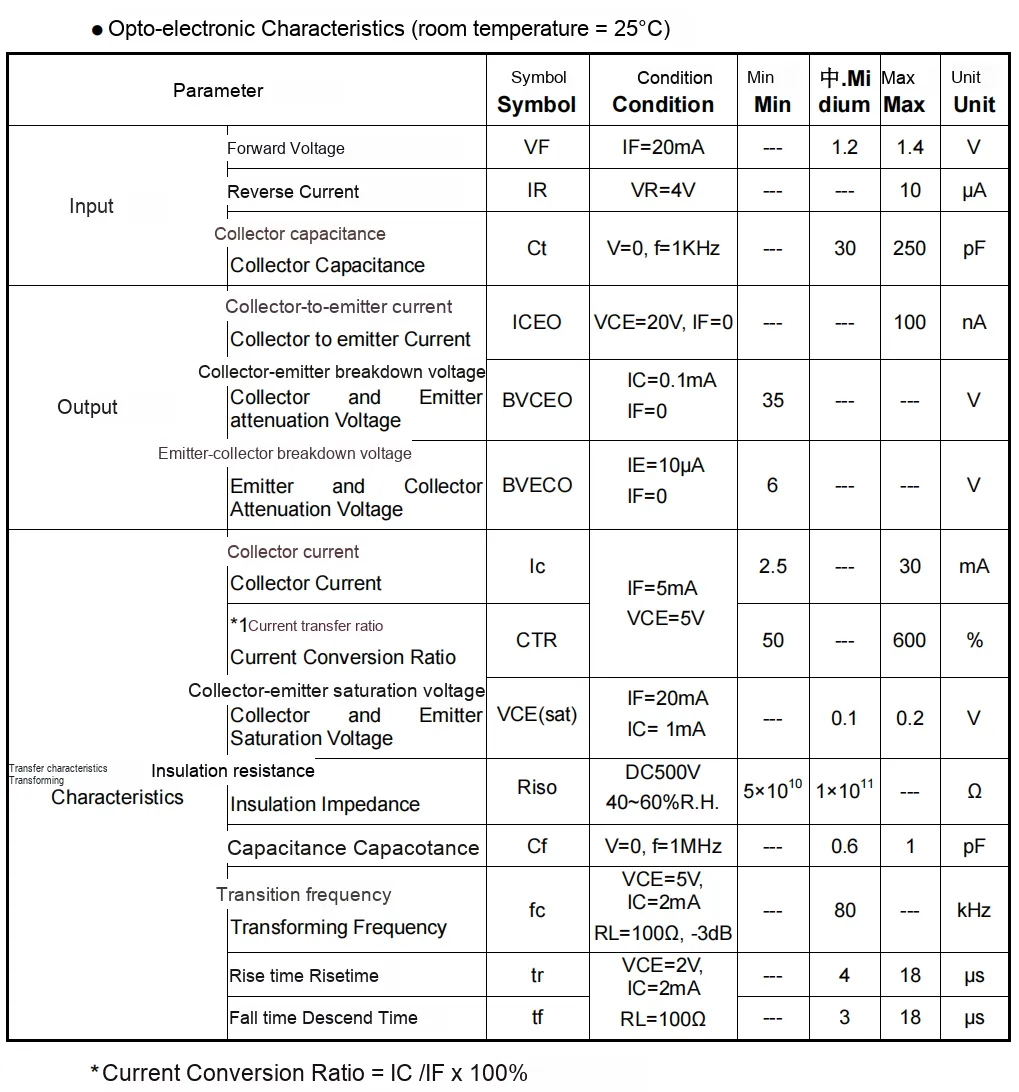
This table presents PC817 optocoupler's optoelectronic characteristics at room temperature (25°C), and the meaning of each parameter should be understood in combination with its "light-emitting diode - phototransistor" structure:
- Input Characteristics (Light-Emitting Diode Side): Forward Voltage
VF(IF= 20mA, typical value 1.2~1.4V) refers to the voltage drop when the light-emitting diode conducts in the forward direction, reflecting its conduction characteristics; Reverse CurrentIR(VR= 4V, maximum 10μA) is the leakage current of the light-emitting diode under reverse bias, and a smaller value indicates better reverse insulation performance; Collector CapacitanceCtis the parasitic capacitance of the phototransistor's collector, which affects the high-frequency signal transmission characteristics. - Output Characteristics (Phototransistor Side): Collector-Emitter Current
ICEO(VCE= 20V, maximum 100nA under no illumination) is the dark current of the phototransistor; a smaller value indicates a lower leakage current when there is no light. Collector-Emitter Breakdown VoltageBVCEO(minimum 35V) is the breakdown voltage between the collector and emitter of the phototransistor, ensuring the withstand voltage of the output terminal. Collector CurrentIc(2.5~30mA whenIF= 5mA) is the output current range of the phototransistor, reflecting its load-carrying capability. - Transmission Characteristics (Core Interaction Indicators): Current Transfer Ratio
CTR(IC/IF×100%, min. 50%, max. 600%) is a core parameter of optocouplers, which reflects the conversion efficiency from "light-emitting diode current to photosensitive transistor current", and its wide range adapts to different driving scenarios; Collector-Emitter Saturation VoltageVCE (sat)(typically 0.1V) is the voltage drop when the photosensitive transistor is in saturated conduction, and the smaller the value, the lower the conduction loss; Insulation ResistanceRiso(5×10¹⁰~1×10¹¹Ω) reflects the insulation isolation capability between the input and output terminals;Transition frequencyfc(typically 80kHz) is the upper bandwidth limit of the optocoupler, which determines the transmittable signal frequency; the rise/fall time (typically 4/3μs) reflects the signal response speed, and a smaller value indicates better dynamic characteristics.
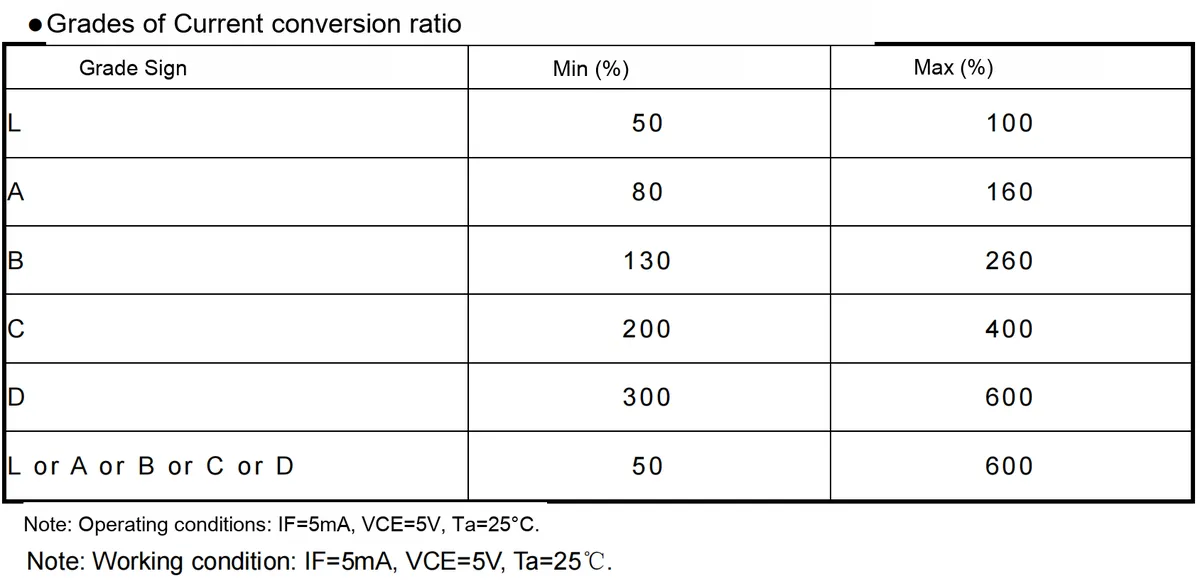
CTR refers to the conversion efficiency of an optocoupler from "input light-emitting diode current to output photosensitive transistor current (CTR = IC/IF × 100%), and different grades correspond to different conversion efficiency ranges:
CTRwith a lower grade (e. g.,L) is suitable for scenarios requiring "low output current and avoidance of over-driving";CTRat a higher level (e. g.,D) is suitable for scenarios where "a small input current drives a large output load".
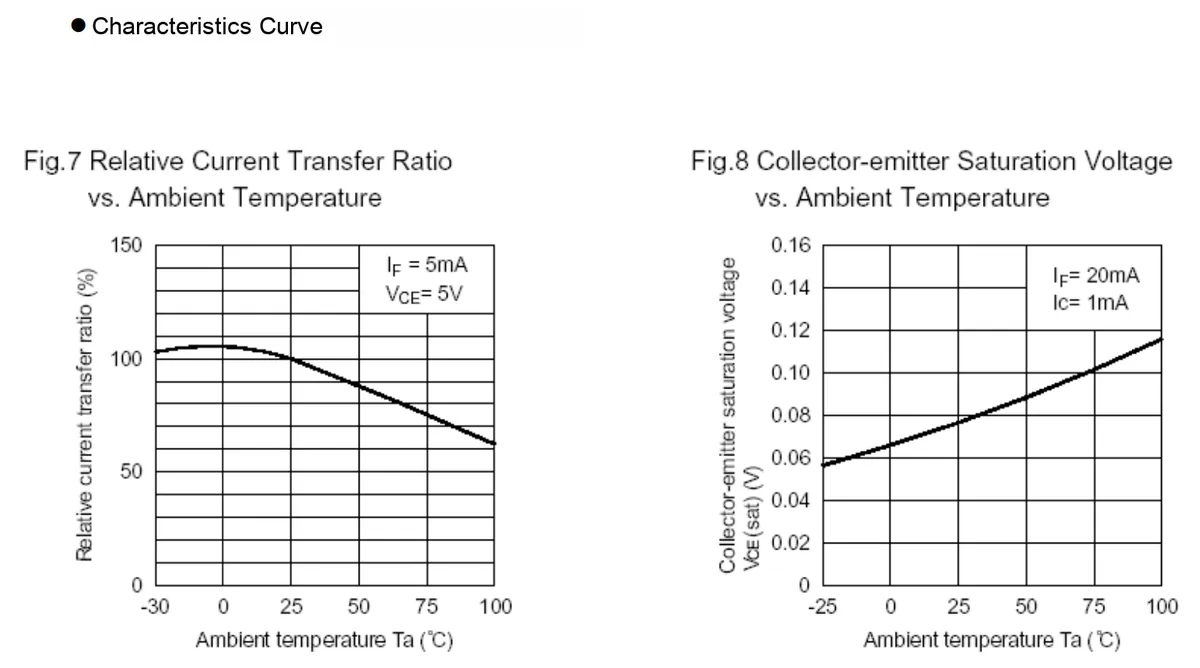
These two characteristic curves reflect the influence of ambient temperature on PC817 the core parameters of the optocoupler:
- Figure 7 (Relative Current Transfer Ratio vs. Ambient Temperature): Operating conditions are
IF= 5 mA,VCE= 5 V. The curve shows that in the range from low temperature (-30°C) to room temperature (25°C), the relative current transfer ratio (CTR) remains basically stable at around 100%; when the temperature exceeds 25°C, the relativeCTRgradually decreases as the temperature rises (drops to approximately 60% at 100°C).This is because the carrier characteristics of the phototransistor are affected by temperature, and an increase in temperature will reduce the conversion efficiency of "light-emitting diode current → phototransistor current", which means that the signal transmission capability of the optocoupler will be weakened in a high-temperature environment. - Figure 8 (Collector-Emitter Saturation Voltage vs. Ambient Temperature): Operating conditions are
IF= 20 mA,IC= 1 mA. The curve shows that the collector-emitter saturation voltage (VCE (sat)) gradually increases as the ambient temperature rises (from approximately 0.06 V at -25°C to about 0.12 V at 100°C).VCE (sat)refers to the voltage drop across the photosensitive triode when it is in saturated conduction; the higher this value, the greater the power loss during conduction. Therefore, high temperature will increase the conduction loss at the output side of the optocoupler, affecting the energy efficiency performance of the circuit.
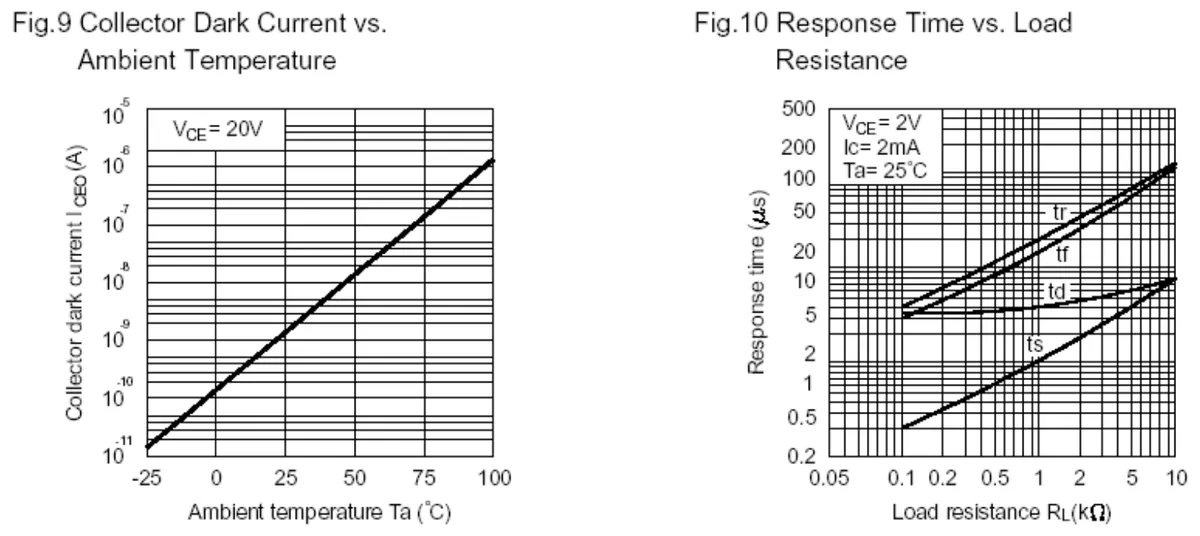
These two characteristic curves respectively reflect the influences of ambient temperature and load resistance on PC817 optocoupler's key parameters:
- Figure 9 (Collector Dark Current vs. Ambient Temperature): The collector dark current (
ICEO) refers to the leakage current between the collector and emitter of the phototransistor when the optocoupler is in a no-light condition (IF= 0), with the test condition beingVCE= 20V. The curve (with the vertical axis in logarithmic scale) shows that when the ambient temperature rises from -25°C to 100°C,ICEOincreases sharply (from approximately 10⁻¹¹ A to 10⁻⁵ A).This is because an increase in temperature will raise the number of hot carriers in the semiconductor, leading to a rise in the reverse leakage current of the phototransistor, which means that the "no-signal interference" capability of the optocoupler will degrade significantly in high-temperature environments. - Figure 10 (Response Time vs. Load Resistance): The response time (including rise time
tr, fall timetf, delay timetd, and storage timets) is a dynamic characteristic of the optocoupler (test conditions:VCE= 2 V,IC= 2 mA, room temperature 25℃). The curve shows that as the load resistanceRLincreases, all response times gradually lengthen (for example, whenRLrises from 0.05 kΩ to 10 kΩ,trincreases from several microseconds to nearly 200 μs).This is because the load resistor determines the charging and discharging rate of the phototransistor's collector. The larger the RL, the slower the current change. Therefore, when the optocoupler transmits high-speed signals, the value of the load resistor needs to be controlled to insufficient response speed.
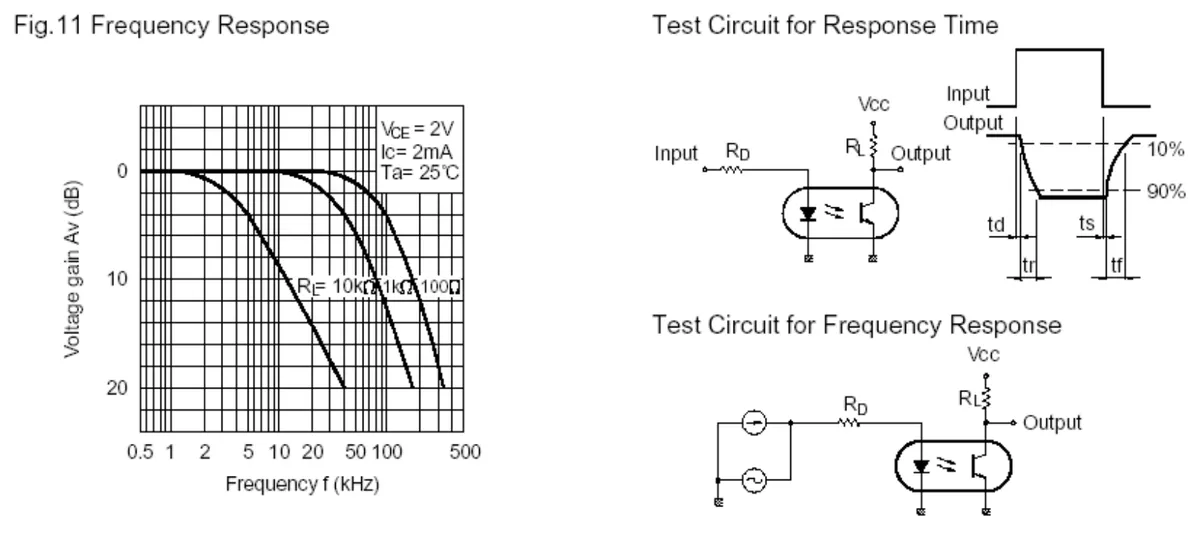
This set of diagrams illustrates PC817 the frequency response characteristics of the optocoupler and the corresponding test circuit, with analysis combined with the meaning of the parameters as follows:
- Fig. 11 Frequency Response Curve: The test conditions are as follows:
VCE= 2 V,IC= 2 mA, room temperature at 25°C; the horizontal axis represents the signal frequency (kHz), and the vertical axis denotes the voltage gainAv(dB). The curve demonstrates that: in the low-frequency band (<10 kHz), the voltage gain remains basically stable around 0 dB; when the frequency exceeds the critical value, the gain decreases as the frequency rises(reflecting the bandwidth limitation of the optocoupler);Meanwhile, the smaller the load resistanceRL(e. g., 100Ω), the higher the "cutoff frequency" at which the gain starts to drop — this is becauseRLis smaller, the smaller the charge-discharge time constant of the phototransistor's collector, the faster the signal response speed, thus it can adapt to higher-frequency signal transmission. - Test circuit on the right side:
- Response time test circuit: the input is connected to a current-limiting resistor
Rd, the output is connected to a loadRL, and by inputting a square wave signal in combination with the Sequence Diagram, the delay timetd, rise timetr, storage timets, and fall timetf(all based on the 10%/90% level criteria) are defined, which is used to measure the dynamic response speed of the optocoupler; - Frequency response test circuit: with the input connected to an AC signal source and
Rd, and the output connected toRL; by measuring the output voltage gain at different frequencies, a frequency response curve is plotted to verify the high-frequency transmission capability of the optocoupler.
- Response time test circuit: the input is connected to a current-limiting resistor
These curves, together with the circuit, clearly demonstrate that: PC817 has its high-frequency transmission capability affected by the load resistance: a smaller load resistance can increase its bandwidth, and the test circuit serves as the standard configuration for verifying these dynamic characteristics.
2.5 Reference Circuit
2.5.1 JMSL0406AG Low-power MOS FET
None.
2.5.2 PC817 Optocoupler Isolation Chip
None.
2.6 Chip Configuration
2.6.1 JMSL0406AG Low-power MOS transistor
None.
2.6.2 PC817 Optocoupler Isolation Chip
None.
2.7 Communication Interfaces and Related Protocols
2.7.1 JMSL0406AG Low-power MOS transistor
None.
2.7.2 PC817 Optocoupler Isolation Chip
None.
2.8 PCB Routing Notes
2.8.1 JMSL0406AG Low-power MOS transistor
None.
2.8.2 PC817 Optocoupler Isolation Chip
None.
3. Instructions for Circuit Engineering and Module Usage
3.1 Circuit Source Engineering
To obtain the circuit source project, please follow the official account [Freak Embedded]
3.2 Module Usage Instructions
The schematic diagram is shown as follows:
SCH_MOSFET Switch Relay Module Based on JMSL0406_v1.0_2025-11-27.pdf 2.4 MB
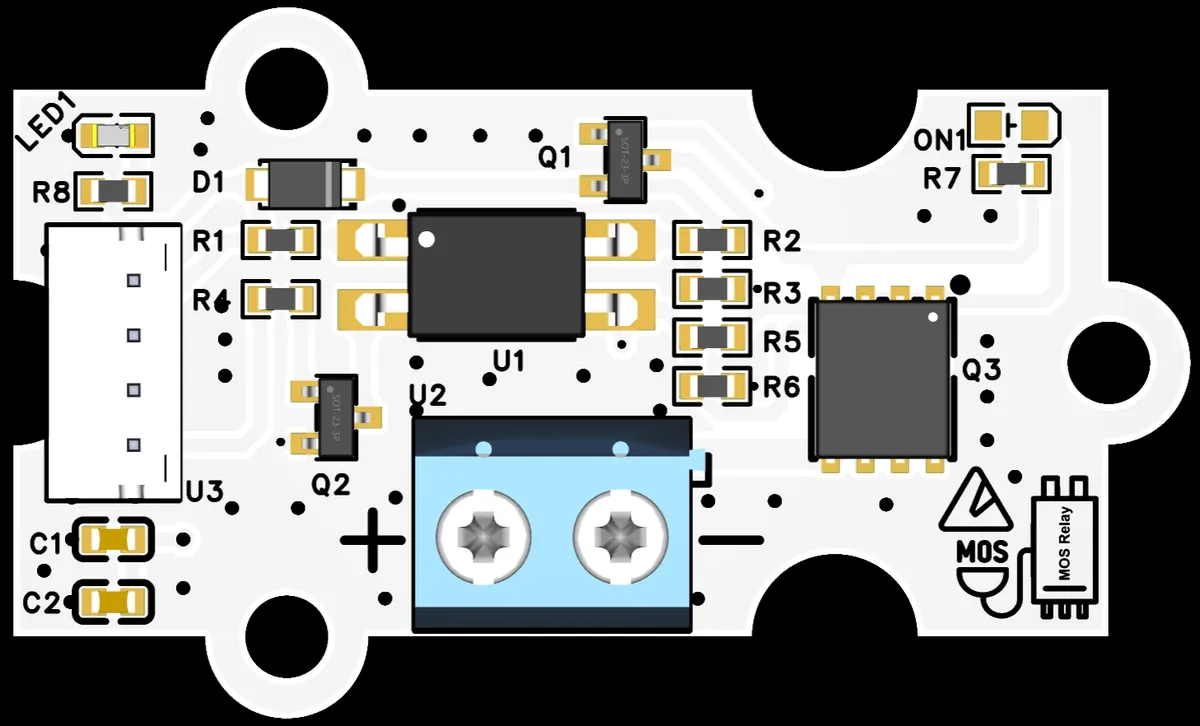
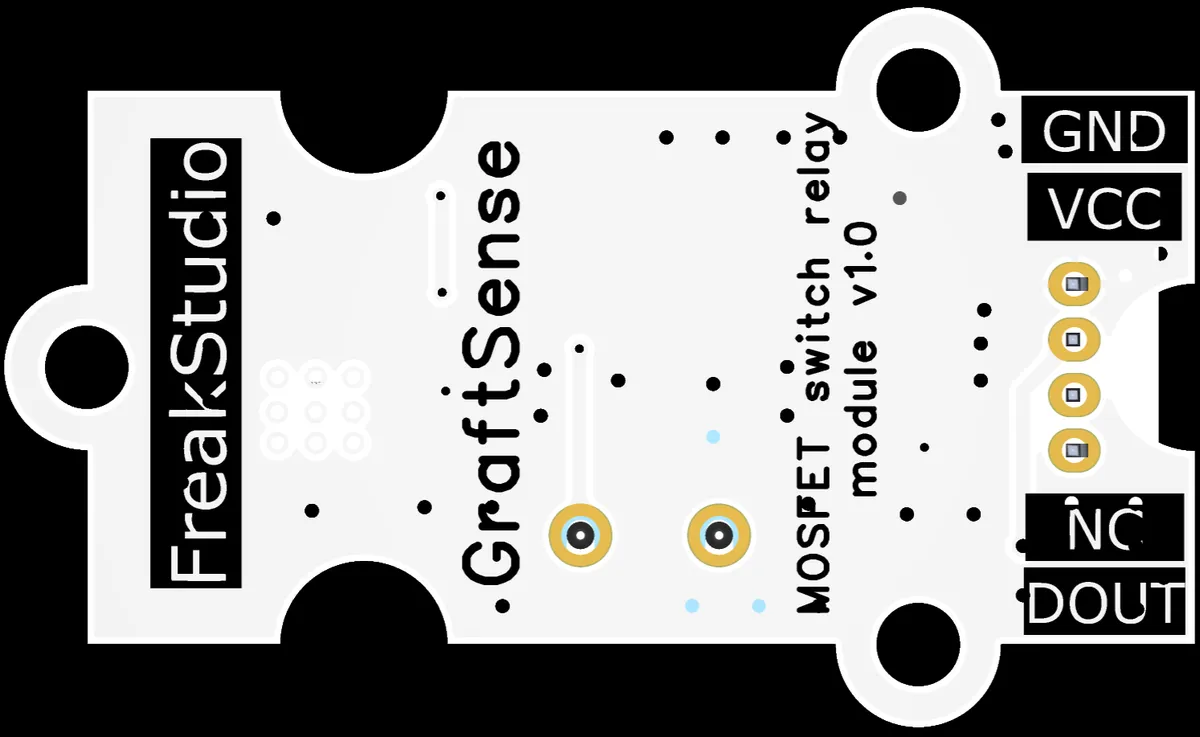
This module provides the DOUT interface, which is used to connect to the MCU 's GPIO
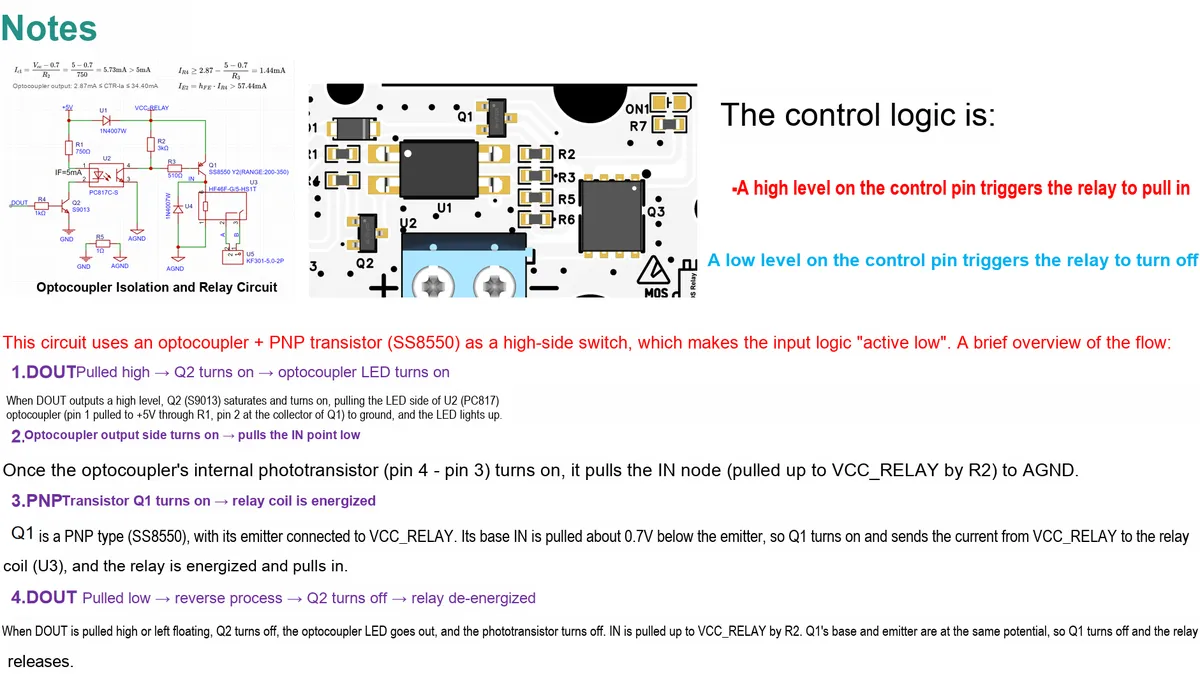
- When
DOUTis at a high level, theS9013transistor turns on, triggering thePC817optocoupler'sLEDto light up. After the output side of the optocoupler conducts, it pulls down the base ofSS8550, turning on theSS8550(PNPtype) and driving the gate ofJMSL0406; theMOStransistor then conducts, supplying power to the relay coil to pull it in; DOUTis at a low level, the circuit is reversely turned off and the relay is released.
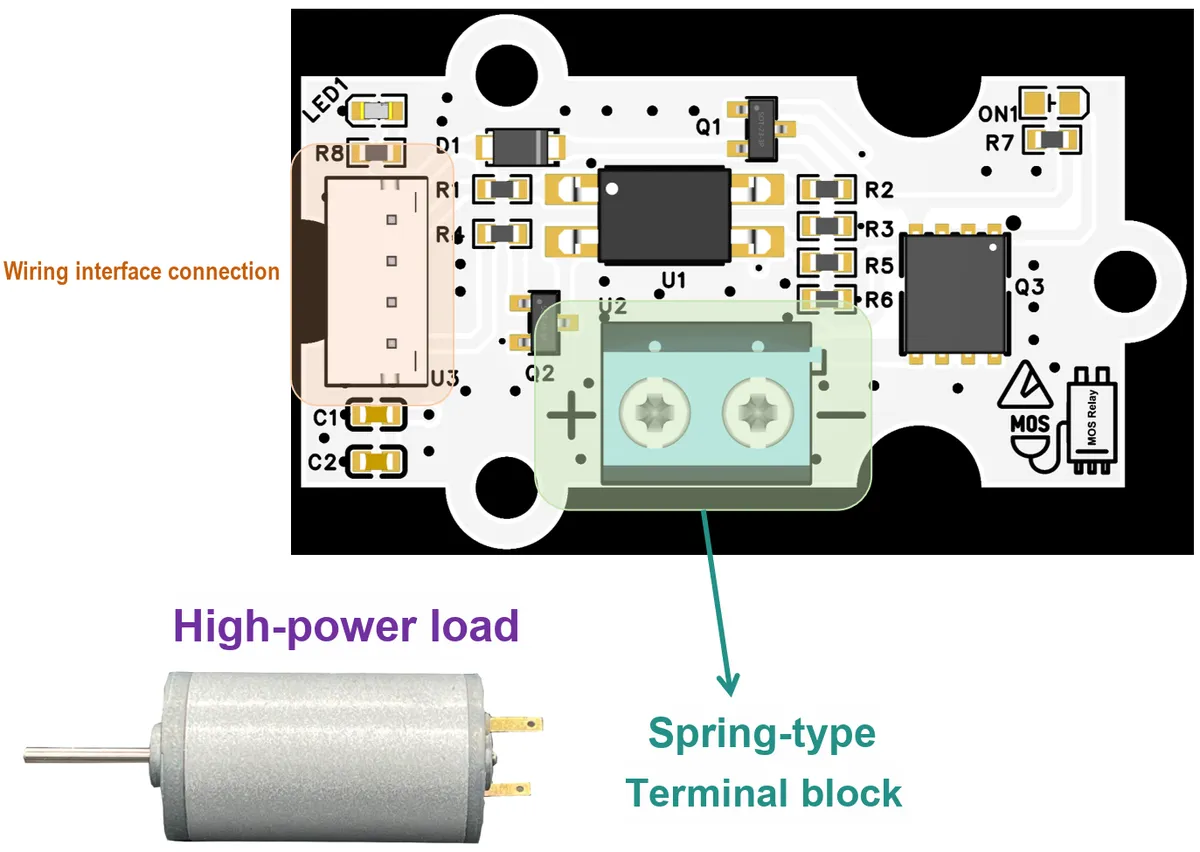
When in use, we can just connect them in the following form:
The detailed analysis and explanation of the circuit principle are as follows:
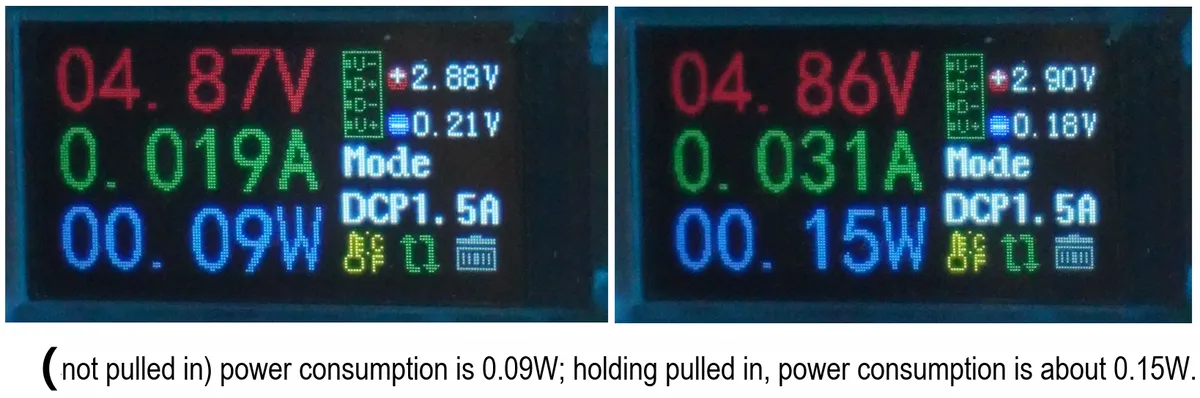
At the same time, we also tested the relevant power:
3.3 Application Experiment
Here, we use the GraftPort-RP2040 development board for testing, and the MOS transistor switch relay module based on JMSL0406 uses the DIO interface on it to communicate with the main controller.
Here, we first use the HY2.0-4P connection cable to connect the module to the GraftPort-RP2040 development board's DIO1 interface:
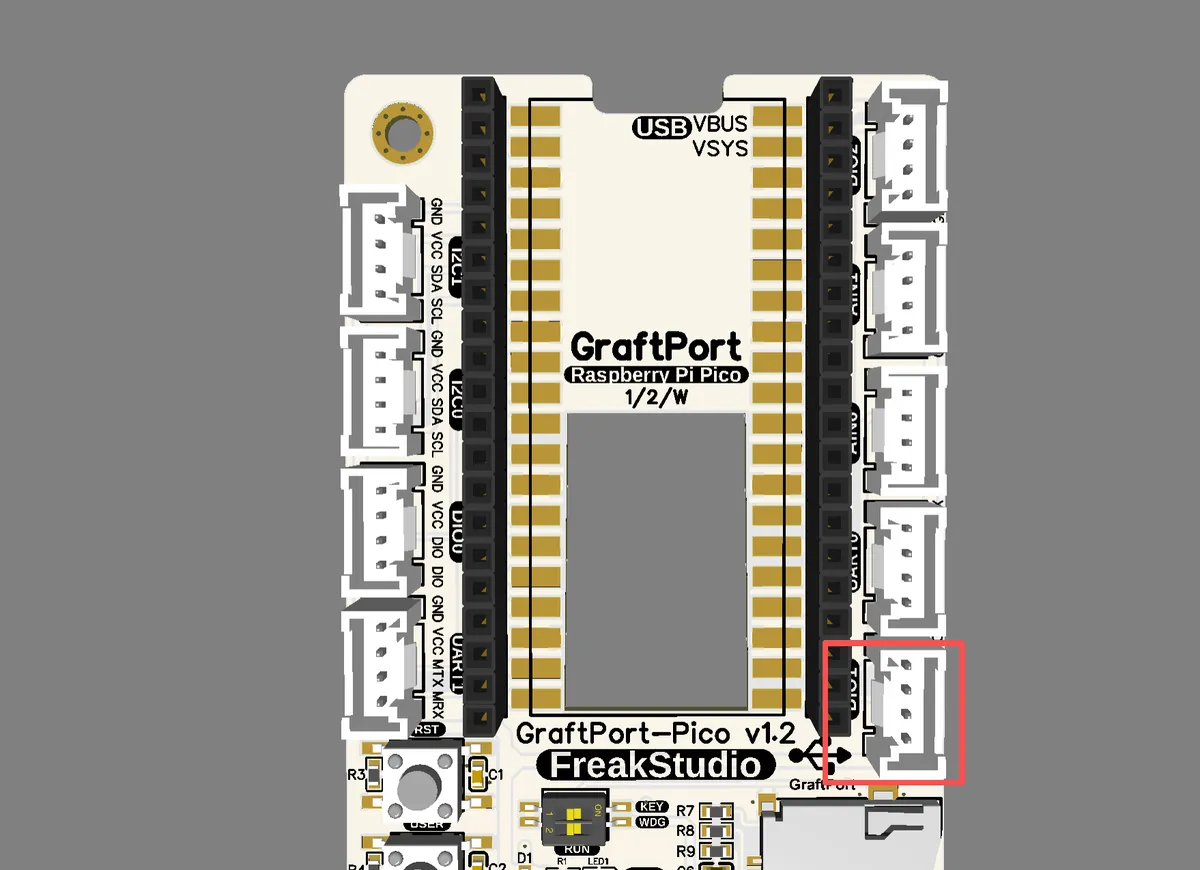
The module connections are shown in the following table:
Development Board Pins | Module Pins | Description |
Pin 14 |
| The pins connected to the MCU output high and low levels. |
Pin 15 |
| - |
- Power supply output
5Vvoltage, which is divided into two lines: positive pole andGND(negative pole). - The positive terminal of the power supply is connected to node
A, serving as the positive input terminal of the power supply backbone. - The positive terminal of the motor (Motor +) is not directly connected to the power supply, but is connected to the output terminal of the relay.
- Power supply
GNDis directly connected to the negative terminal of the motor (motor -) to form the foundation of the circuit.
Here, we need to search for the relevant driver packages on uPyPI: https://upypi.net/zh/

Enter relay_driver to search, and the following will be displayed:

Click to copy the local installation command:

Import the module driver library code via the mip tool. Below are the usage commands for the mpremote tool:
mpremote mip install https://upypi.net/pkgs/relay_driver/1.0.0After importing the relay module driver - MicroPython driver code, copy the following main.py code into our project:
# Python env   : MicroPython v1.23.0
# -*- coding: utf-8 -*-
# @Time    : 2024/7/28 3:00 PM
# @Author  : Li Qingshui
# @File    : main.py
# @Description : Relay test example

# ======================================== Import Modules ========================================

# Import time-related modules
import time
# Import the relay module
from relay import RelayController

# ======================================== Global Variables ============================================

# If it is a 'normal' type relay, use GP14
RELAY_TYPE = 'normal'   # 'normal' or 'latching'
RELAY_PIN1 = 14           # Control pin 1
RELAY_PIN2 = 15           # Control pin 2

# Music rhythm definition (unit: ms)
# Each tuple represents (duration, whether to toggle at the end)
MUSIC_NOTES = [
    # Strong rhythm in the intro
    (50, True), (50, False), (50, True), (50, False),  # 4 fast consecutive beats
    (100, True), (100, False),  # Slow down for 2 beats
    (50, True), (50, False), (50, True), (50, False),  # Repeat 4 fast beats

    # Verse section
    (150, True), (50, True), (200, False),  # Strong-light-long pause
    (100, True), (100, True), (100, True), (100, False),  # Three consecutive hits
    (80, True), (80, True), (160, False),  # Double beat + long pause
    (60, True), (60, True), (60, True), (60, True), (120, False),  # Four fast consecutive hits

    # Chorus climax
    (40, True), (40, False), (40, True), (40, False),  # Ultra-fast eighth notes
    (40, True), (40, False), (40, True), (40, False),
    (200, True), (200, False),  # Strong downbeat
    (300, True), (100, True), (200, False),  # Long-short combination

    # Bridge tempo change
    (120, True), (80, True), (120, True), (80, False),
    (200, True), (50, True), (50, True), (200, False),

    # Ending slows down gradually
    (150, True), (150, False),
    (200, True), (200, False),
    (300, True), (300, False)
]
# ======================================== Functions ============================================

# Simple music playback function
def play_relay_music():
    for duration, should_toggle in MUSIC_NOTES:
        # Toggle the relay state
        relay.toggle()
        time.sleep_ms(duration)
        if should_toggle:
            # Toggle back again
            relay.toggle()
            # Add a small interval to prevent toggling too fast
            time.sleep_ms(50)

# ======================================== Custom Classes ============================================

# ======================================== Initialization ==========================================

# Power-on delay of 3 s
time.sleep(3)
# Print debug information
print("FreakStudio: Using GraftPort to control relay")

# Initialize the relay controller
if RELAY_TYPE == 'latching':
    relay = RelayController(RELAY_TYPE, RELAY_PIN1, RELAY_PIN2)
else:
    relay = RelayController(RELAY_TYPE, RELAY_PIN1)

# ========================================  Main Program  ===========================================

# Turn on the relay
relay.on()
print('relay.on')
# Delay 1s
time.sleep(5)
# Turn off the relay
relay.off()
print('relay.off')
To flash the code, open a terminal and use the mpremote tool to connect to the main controller; the output is as follows:

When the relay closes, the motor runs; after 5 seconds, the relay opens and the motor stops.
IV. Drivers
relay_driver.zip 11 KB
5. BOM & Recommended Alternative Parts
None.
VI. Revision History
Document Version | Date of Revision | Modifier | Modify Content |
v1.0 | 2025-11-26 | Li Zisheng | Initialize the document The BOM sheet has not been finally checked, the driver has not been re-verified, and the 3.3 application experiment Not yet specified. |
v1.1 | 2025-12-29 | Li Zisheng | Added application experiments and production files |
v1.2 | 2025-12-31 | Xin Ruili | Create an open version of the document based on the internal document version v1.1. |
v1.3 | 2026-03-29 | Xin Ruili | Modified the application experiment section |
VII. Relevant Materials
7.1 Chip Datasheet
C2890432_MOSFET_JMSL0406AG_Datasheet_WJ329969.PDF 290 KB
C3008369_Transistor Output Optocoupler_PC817C-S_Datasheet_WJ644212.PDF 461 KB
7.2 Unique Icons for PCB Silk Screen