
You want a handheld tool to show where an object is warmer, or an interactive device to respond when a warm hand enters its view. A small thermal array can make those ideas tangible. But a useful heat pattern and a trustworthy temperature measurement are different goals, and that distinction should shape the first prototype.
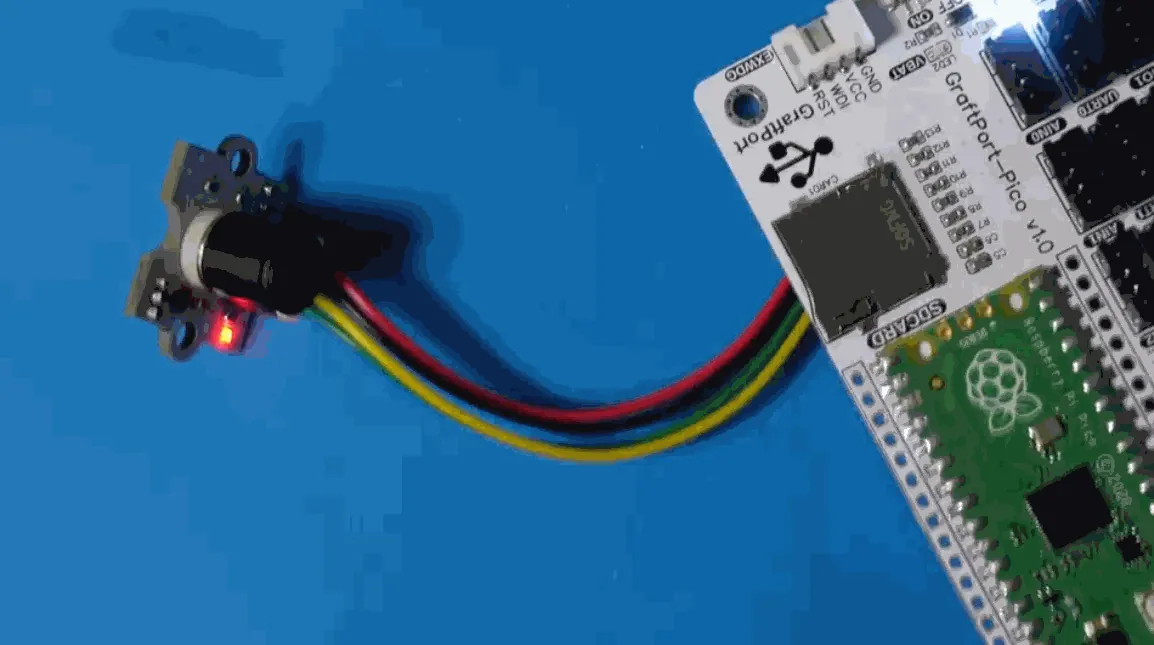
On our bench we connected an MLX90640 32 × 24 infrared array, on a GraftSense module, to a GraftPort carrier with a Raspberry Pi Pico (RP2040) running MicroPython, and printed temperature data while a hand moved above the sensor. It was a real starting point. It also exposed data-quality problems that need resolving before a display can be treated as a thermometer.
Choose the job before choosing the display
For a thermal-view prototype, the first question might be "can a user locate a warm region?" For an inspection tool, it could be "can we compare the same location under two operating conditions?" Neither question is answered by drawing a smooth color gradient. Other builders have taken the same path; Hasan Sawan's Flipper Zero thermal camera, for example, adds display modes, logging and streaming around this class of sensor. That is a separate project, not evidence about our setup's accuracy.
The array has 768 measured locations. Enlarging the image on a screen can improve readability, but interpolation does not add measurements. If the object you care about occupies only a fraction of one pixel's view, more screen pixels will not recover its missing detail.
Match the view to the size and distance of the target
The manufacturer's two lens variants trade coverage against detail: BAA has a nominal 110° × 75° field of view; BAB has 55° × 35°. A wider view covers more of a nearby scene, while spreading the same number of sensing pixels across that larger area. Choose using the target size and intended working distance, not the word "wide" alone.
The datasheet also shows accuracy zones by lens variant. Read them alongside the actual variant and the specified test conditions. They are not a reason to promise that every edge pixel is as accurate as a central one, or that one variant is better for every task.
Before drawing a front panel, leave the sensor's optical path clear. The Melexis MLX90640 datasheet explains the required unobstructed field of view and thermal settling behavior. A recessed opening or added cover has to be evaluated as part of the optical arrangement, not chosen only for appearance.
The bench connection
We used the carrier's I2C0 connector: GP4 for SDA and GP5 for SCL. The example scans the bus at 100 kHz and initializes the sensor, normally at address 0x33. Check the sensor supply, board regulation and I2C pull-up voltage on your actual hardware revision before connecting another controller. A pull-up resistor on each line does not, by itself, establish compatibility between arbitrary voltage levels.
If you reproduce this, start from an MLX90640 example. The same driver family also covers the MLX90614 and MLX90615, which are single-point sensors; an example written for them will not produce an array. The MLX90640 program we ran allocates 768 output values, selects a 2 Hz refresh setting and requests data in a loop. It prints minimum, maximum and average values for the buffer, plus the top-left 4 × 4 section. That small section is a debugging view of a larger array, not the sensor's resolution.
Read the whole frame before trusting its statistics
The sensor updates alternating subpages. In chess mode the pattern resembles a checkerboard; in interleaved mode, alternate rows are updated. The other locations keep older data until their turn comes.
In the driver we used, each get_frame() call processes one subpage. The application then immediately calculated statistics across the whole buffer. At startup that mixes newly calculated temperatures with values that have not been filled yet, and later calls still need to track which subpages have arrived and how old they are.
Our terminal output showed exactly this. The sample grid had alternating zero entries, and every frame reported a minimum of −273.15 °C with an average around 11 °C. The driver uses that very low number as a marker for bad or outlier pixels; it is not an object at absolute zero. With invalid and unfilled entries included, the printed average is not a usable scene temperature.
The next software step is to assemble and track both subpages, handle flagged pixels explicitly and calculate statistics only over valid data. The Melexis MLX90640 library is a useful comparison for acquisition, compensation and bad-pixel handling. We have not yet run a corrected version on hardware.
Keep the temperature assumptions visible
Infrared temperature calculation depends on the surface and the radiation it emits and reflects. A setting that works for one target may not suit another. Our example assigned an emissivity of 0.92, but the driver calculated with a fixed local value of 0.95. Changing the application attribute therefore did not change the calculation. Check that the value you set is the value actually used.
For a prototype test, choose a stable target and compare the relevant region against a suitable reference measurement. Keep target material, distance, angle and sensor warm-up consistent. A moving hand is useful for showing a changing scene, but it is not that comparison.
Let the sensor settle after power-up and after changes in its surroundings. The Melexis documentation distinguishes electrical startup from thermal stabilization and notes that reaching specified accuracy can take up to four minutes. A plausible first frame is not the end of the warm-up check.
The same care applies to speed. The driver exposes refresh settings as encoded values, so what a property prints is not a measured frame rate. Time the collection of complete frames, the temperature calculation and the screen update before promising a smooth handheld experience.
Decide what the first usable version should do
For an interactive exhibit, recognizing a repeatable warm region may be enough to test the interaction. For a diagnostic tool, users may need a consistent temperature scale, a known target region and saved readings under repeatable conditions. A medical, fire-protection or safety claim needs evidence well beyond this test.
Keep the raw numeric data available while trying color palettes. If each frame rescales its colors independently, a red area can look dramatic even when the temperature range is small. Label the scale and make invalid pixels recognizable, so the presentation does not hide uncertainty.
The practical next step is a complete-frame acquisition test, followed by a controlled target comparison at the intended distance. Once those pass, you can judge whether this resolution supports your use case and whether an enclosure and display are worth developing around it.