
You have a probe connected to your board, a number on the screen and a handheld meter beside it. Both instruments are in the same water, yet their readings disagree. Before designing a reassuring green indicator for an aquarium monitor or water-filter prototype, you need to understand what each number means.
First-time builders hit this often. A recent shrimp-keeping discussion shows one pair of conflicting meter readings; other hobby forums have similar threads where two meters agree near zero in distilled water and disagree on the tank sample. None of them establishes a universal rule for choosing the correct meter.
On our bench we connected a GraftSense BA111 TDS module and probe to an RP2040 controller, configured its temperature sensing, ran a baseline calibration and read results in MicroPython. Walking through that sequence separates a working connection from a measurement you can explain to a user.
First, know what the displayed number represents
TDS means total dissolved solids. Instruments like this estimate it from electrical conductivity, how readily the water carries current. The conversion depends on assumptions about the dissolved material, so two instruments can use different scales even when they measure similar conductivity. Hanna Instruments explains the relationship, including the conversion factor.
For example, a hypothetical conductivity of 400 µS/cm gives 200 ppm with a factor of 0.5 and 280 ppm with a factor of 0.7. That arithmetic shows why settings matter; it does not diagnose any particular disagreement. The BA111 documentation describes a built-in conversion algorithm but does not establish that its scale matches your reference meter.
A TDS reading also does not identify individual contaminants or show that water is safe to drink. The US EPA places TDS among its secondary standards, which address aesthetic effects such as taste, not a complete health assessment. For this kind of prototype, the useful task is to display a traceable measurement and its context, not a health verdict.
The probe and the controller are two separate interfaces
The module has one connector for the controller and another for the probe. The probe assembly contains both the conductivity electrodes and a temperature sensor: black and red go to the TDS electrodes, white and yellow to the NTC temperature sensor. An NTC is a resistor whose resistance changes with temperature.
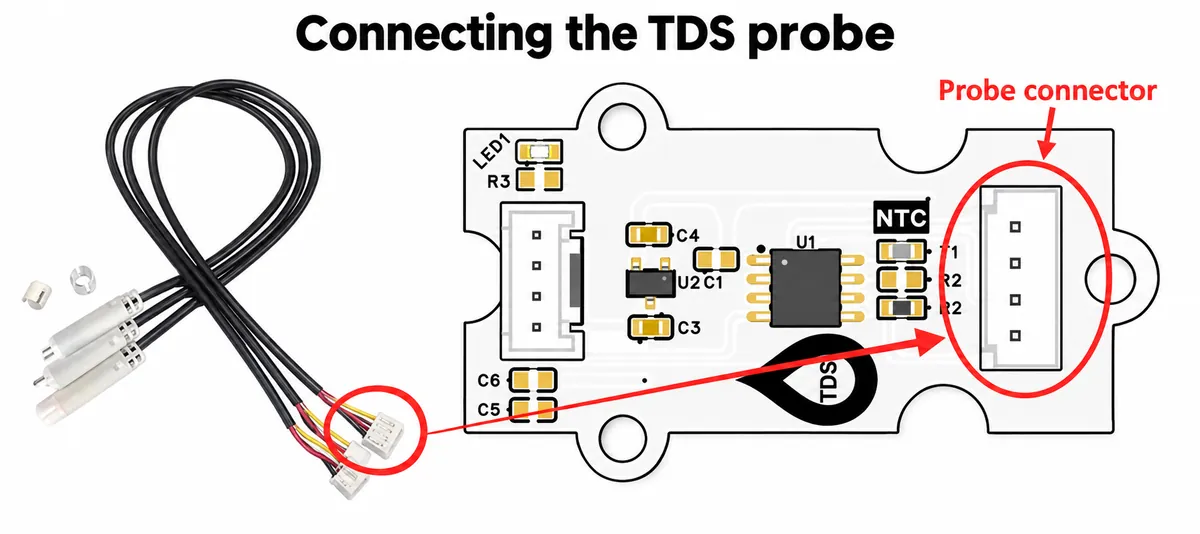
We ran a four-wire HY2.0 cable from the GraftPort-RP2040's UART0 port to the module and plugged the probe into the XH2.54 four-pin socket. UART is the serial link: the controller sends a request and the module returns a measurement. Controller transmit was GP16 and receive GP17. The MTX and MRX labels on the carrier are written from the controller's point of view, so follow the verified pin mapping rather than guessing the direction.
The carrier takes 5 V and feeds a 3.3 V regulator. That is different from applying 5 V directly to the BA111 chip, whose normal supply in the reference design is 3.3 V.
Set up the temperature measurement before trusting compensation
We installed the BA111 driver package through the MicroPython package index, on MicroPython 1.26.1. Keep the driver version with your experiment record so a later package update does not silently change a comparison.
The program opened UART0 at 9600 baud, 8 data bits, no parity, 1 stop bit, and configured a nominal 10 kΩ NTC with a B value of 3950. The B value describes how that resistance depends on temperature. These settings must describe the probe actually fitted; they are not values to copy because another probe also has four wires.
The BA111 V1.1 reference lists a default B value of 3435, while our test program wrote 3950. That can be correct for a different probe, but we could not identify the fitted NTC well enough to confirm the match. Check it before using temperature-corrected readings for a product decision.
Temperature compensation matters because conductivity changes as the sample warms or cools. The supplier's reference curves compare compensated and uncompensated results in two sodium-chloride standards.
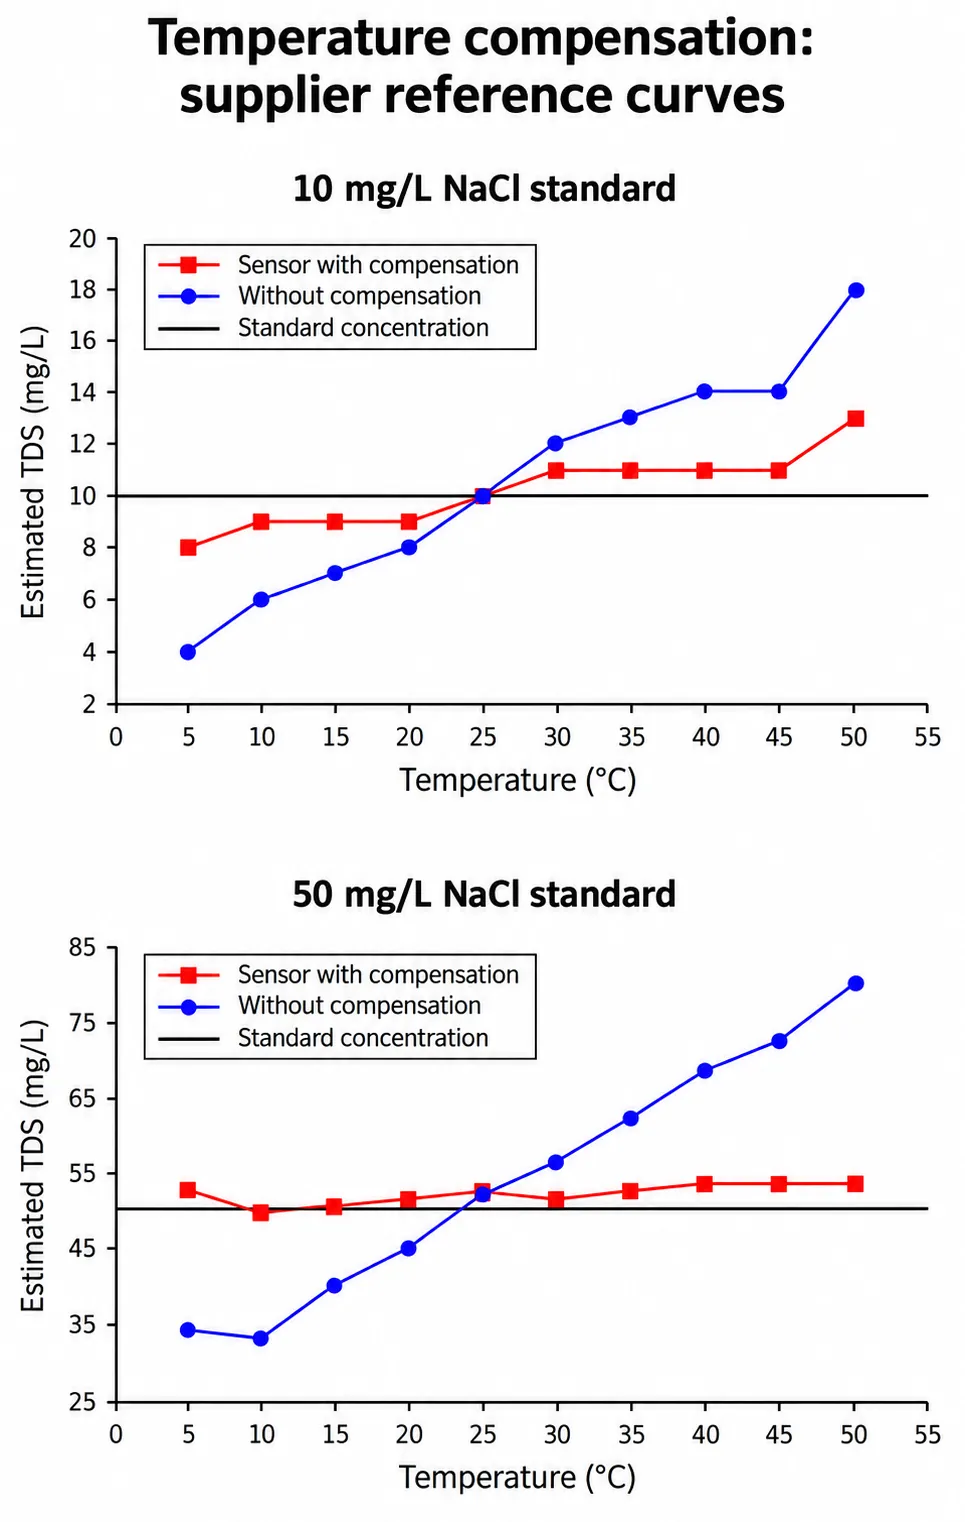
These curves explain the purpose of the temperature input; they are not tests on our assembled board. Even the compensated traces vary. And the manufacturer's stated error is less than 2% of full scale, not 2% of whatever reading appears. On a 3000 ppm scale, 2% is 60 ppm. That helps interpret the specification; it is not a measured uncertainty for this prototype.
Calibration and reading sequence
After configuring the probe, the program paused at a prompt. The documented procedure places the probe in pure water at 25 °C ±5 °C before sending the baseline-calibration command. (Our prompt text printed a minus sign where the chip reference says ±5 °C.)
The program called sensor.calibrate() and entered its reading loop only if that call reported success. Each sensor.detect() call requests a measurement; the driver checks the response header and checksum, then returns TDS in ppm and temperature in °C. The loop printed them and waited one second.
That gives useful checkpoints: the controller can send commands, the sensor acknowledges calibration and the host decodes responses. A calibration acknowledgement alone does not document the water used, its actual temperature or agreement across the range you plan to measure.
In our log, displayed TDS stayed around 132 ppm while temperature fell from about 21.97 °C to 21.46 °C. Some extra bare numbers in the output came from debug prints inside the driver, not from a second measurement channel. We did not record the sample's identity or compare against a reference meter, so the run shows communication and repeatable output. It does not prove that 132 ppm is accurate or that the water suits any particular use.
Make the next experiment a fair comparison
For a user-facing prototype, repeat the test with a documented sample and a reference instrument whose conversion factor and temperature settings you know:
- Record the probe, configuration, sample temperature, placement and stabilization time.
- Compare instruments one after the other if their probes can interfere electrically.
- Use fresh standards according to each manual. Hanna's calibration guidance explains why contaminated or reused standards undermine the comparison.
Agreement at zero does not prove agreement across the range. Check points relevant to your application, repeat the measurements and keep the raw readings. For the BA111, establish the manufacturer's supported calibration procedure and a suitable comparison standard; do not replace its baseline procedure with another meter's instructions.
Those results tell you what the interface can honestly say. A prototype may be ready to show a measured trend while still needing work before it can trigger a maintenance recommendation. Define the action you want the user to take, then test whether the probe, firmware and installation together support that action consistently.