
You are building a small device to track vibration, sound or another changing signal. The sensor produces numbers, the chart looks tidy, and a moving average makes it look better still. Before using that chart to compare prototypes, ask a different question: did the device collect the information you needed in the first place?
A polished graph can hide a sampling problem. If the input changes too fast for the acquisition system, a fast signal can show up as a slower one. More decimal places and smoother lines do not resolve that ambiguity. The decision starts with the physical changes you want to observe, then the sensor, the input filtering and the actual sampling rate.
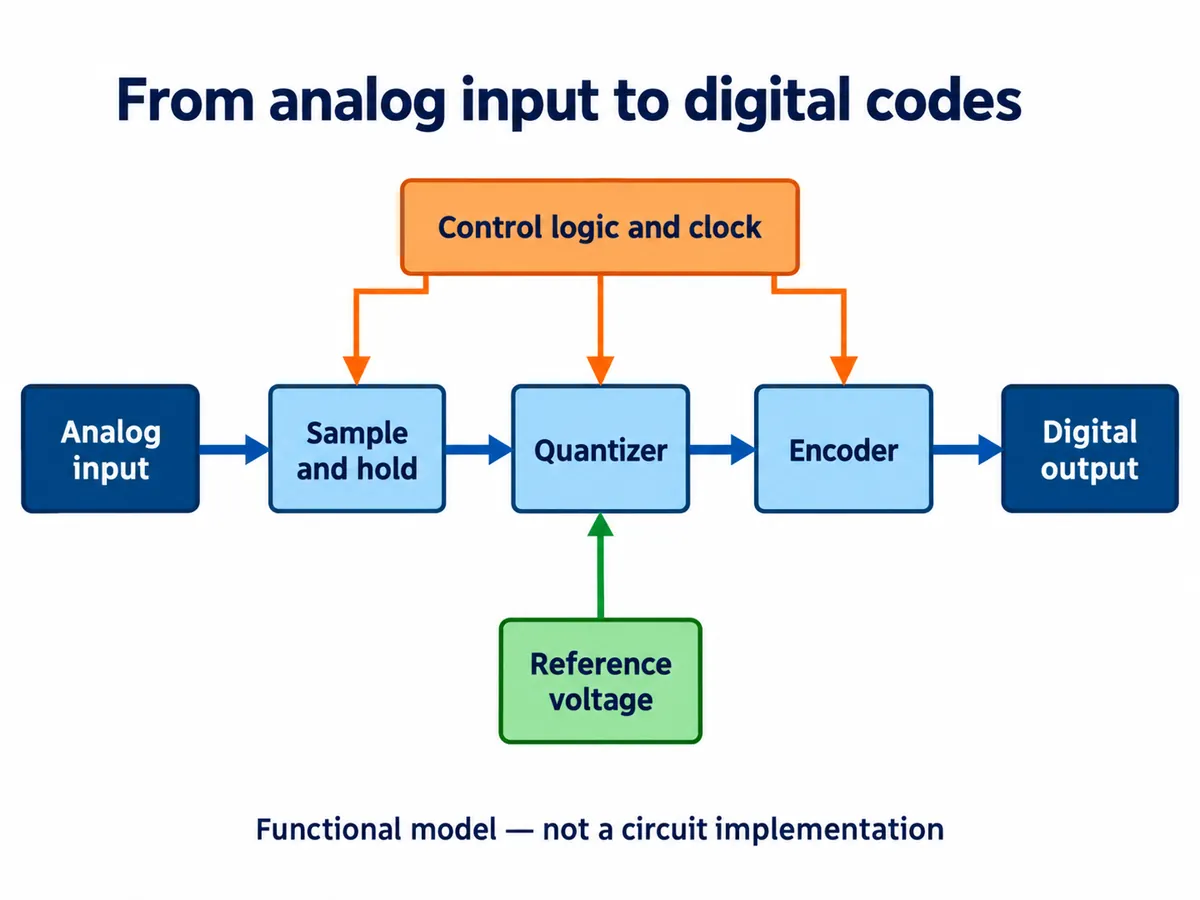
This note separates those steps. The diagrams explain conversion; they are not measurements from a finished vibration monitor. They are useful when a team moves from "the sensor works" to deciding whether its recorded data can support a product decision.
Decide what "fast enough" means for your product
"Monitor vibration" is not yet a sampling requirement. Detecting that a machine is running, identifying a particular vibration frequency and recording a short impact are different jobs. A useful brief says which event matters, which frequencies or durations carry that information, and what error would change the decision. It also says whether you need the raw waveform or only a slowly changing summary.
An Arduino forum discussion from February 2021 shows the gap: a developer wanted to record appliance vibration across a broad frequency range and asked whether a sensor's update rate was enough. The thread is a question about choosing an acquisition system, not evidence that a particular sensor or rule of thumb solved it.
Follow the data path in your own prototype. A sensor can measure internally at one rate, provide filtered results at another, and be read by your application less often still. Drawing a chart 20 times per second tells you nothing about which of those rates governed the measurement itself. Ask the engineer to name each rate and show how samples are timed and kept.
Two different signals can leave the same samples
Take a deliberately simple example. Sample a 70 Hz cosine wave at exactly 100 samples per second. At those sample instants its values equal those of a 30 Hz cosine wave with the same amplitude and starting phase. From the numbers alone you cannot tell which input was present. That ambiguity is aliasing.
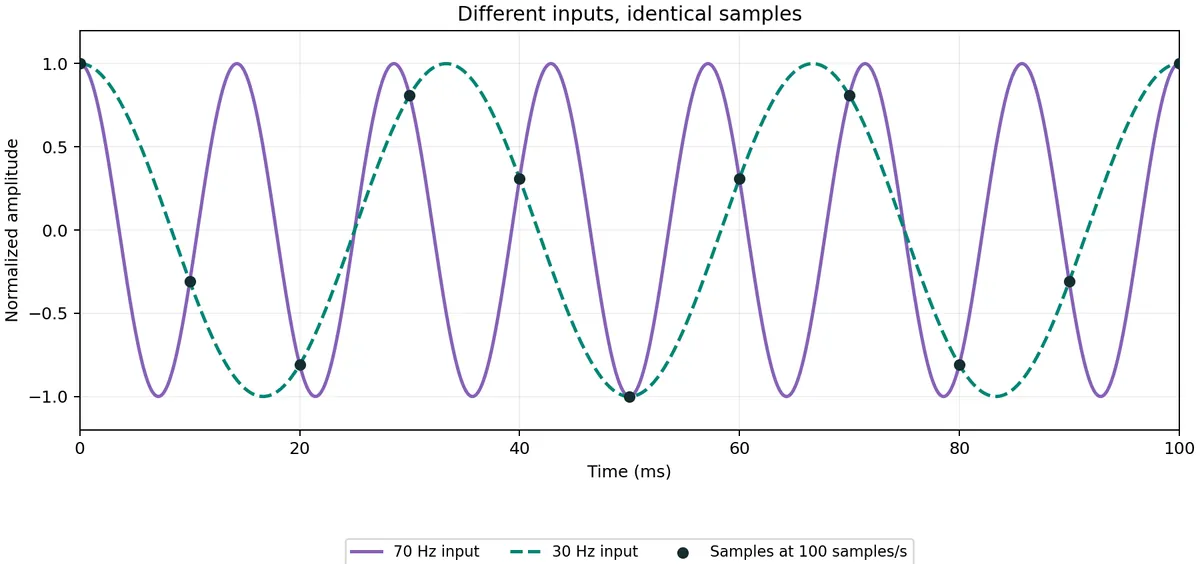
A moving average processes the numbers you already have. It may change how large or smooth the aliased signal looks, but it cannot tell which of the two inputs produced the identical sequence. That is why Analog Devices explains anti-alias filtering before conversion. Once unwanted content has folded onto useful content, ordinary downstream filtering cannot separate them by frequency.
For ordinary baseband acquisition, the wanted signal bandwidth has to sit below half the sampling rate, with practical room for the input filter to reduce unwanted content. That is a design condition, not an instruction to sample at exactly twice your favorite frequency. NI's explanation of practical anti-alias filters shows why a real filter needs a transition band. The margin depends on the filter and on the interfering signals; there is no universal multiplier.
More bits solve a different problem
After sampling, each voltage is mapped to a digital code. In a teaching example, a 0 to 1 V range split into eight bins needs three bits, and two voltages inside one bin get the same code. More codes can distinguish smaller amplitude differences, within the real converter's noise, reference and other limits.
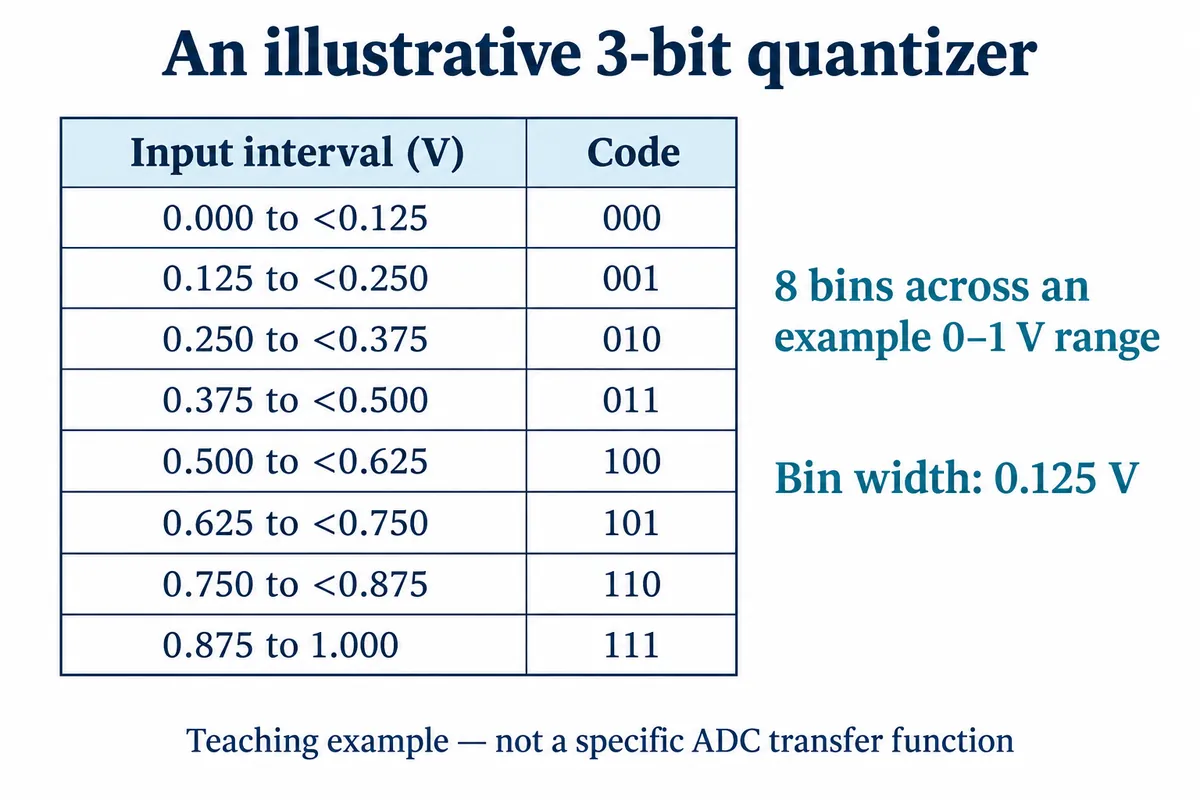
That is a separate matter from observing the signal often enough. A converter with more bits can still sample too slowly, and a faster converter can still lack the amplitude resolution you need. Keep the two requirements apart when comparing modules: one is about when you observe, the other about how finely you represent each observation. The staircase you see in a sample-and-hold plot shows change between sample instants; it is not a measurement of quantization error.
Check acquisition before changing the chart
For a prototype review, start with a known input inside the intended measurement band and keep the unprocessed samples. Verify the actual interval between samples, and check whether logging, display updates or networking interrupt collection. A delay in the program loop is only part of that interval if other work happens between reads, and a stable average rate does not prove the timing is uniform.
Then apply a relevant out-of-band input from a suitable controlled source through the real acquisition path, to find out whether unwanted content is rejected before it affects the result. Filter design has to respect the sensor output and the ADC input requirements; an arbitrary capacitor is not a substitute for that check. With a digital sensor, read its internal sampling and filter description rather than treating the host's polling interval as the whole system.
Finally, compare raw and processed results against the decision the device is meant to support. Smoothing can still be useful for a readable display, but keep enough information to explain what was removed and what delay was added. Record the sensor settings, acquisition rate, filter settings and software version with each test, so the result can be repeated when the enclosure, firmware or sensor changes.