
Your desktop weather display produces sensible-looking numbers, but its pressure reading disagrees with the weather app on your phone. Before adding a correction until they match, check whether the two are reporting the same quantity. One may show pressure where the sensor sits; the other may show a value adjusted to sea level.
A small team making an environmental display for a home, classroom or exhibition needs to make that distinction understandable. The first milestone is a pressure reading with a known unit and meaning. Weather interpretation, trends and a polished interface can then build on a value you can explain.
On our bench we connected four pressure modules, ICP-10111, MPL3115A2, BMP581 and BMP280, to a GraftPort-RP2040 controller board running MicroPython and read each one out to a console. The runs show the practical path from a connected module to printed output. They also show why a first reading needs interpretation before it becomes a product promise. None of them is a calibration against a reference instrument.
Compare the same kind of pressure
For a display that stays on a desk, you could show pressure at that location or a sea-level-adjusted value intended for comparison with weather reports. Choose one and label it. Do not quietly add the first observed difference to every later reading: the discrepancy might come from the reference convention, units or software rather than a constant sensor offset.
This distinction often trips people up. In an Arduino forum discussion from March 2018, a user compared a sensor reading of 977 hPa with weather reports around 1013 to 1015 hPa. The replies explained the difference between pressure at the sensor's location and pressure adjusted to sea level. Those are different quantities, so their disagreement is not automatically a calibration error.
NXP's pressure-altimetry application note AN4528 explains the relationship between local pressure, height and a sea-level reference. For a fixed weather display, keep its installation height and reference convention with the configuration. A standard-atmosphere constant is not a measurement of today's weather.
Read the output, then check what it means
Our BMP280 example used a fixed 1013.25 hPa reference in its altitude formula. The console showed roughly 1015.3 hPa and calculated heights around -17 m. That is the expected result of the chosen formula and reference; it does not mean the bench was below sea level, and we made no independent height measurement.
The same console printed Humidity: 0.00% on every line, and the driver contains humidity-related code. The Bosch BMP280 datasheet describes a pressure-and-temperature device. That zero is not a measured humidity result, and the field should not appear in a product interface.
For a weather display, leave derived altitude out of the main interface unless the user has a reason to see it. Label pressure clearly, keep its unadjusted value in the development log, and identify any adjustment separately. Then you can investigate a disagreement without losing the raw measurement inside a display calculation.
Connect the module you actually have
We set the BMP280 carrier's address to 0x76 and connected it to I2C1, with GPIO2 for data and GPIO3 for clock. The other three modules used GPIO4 and GPIO5 on I2C0. These are our recorded configurations, not interchangeable wiring instructions for every carrier sold under the same sensor name.
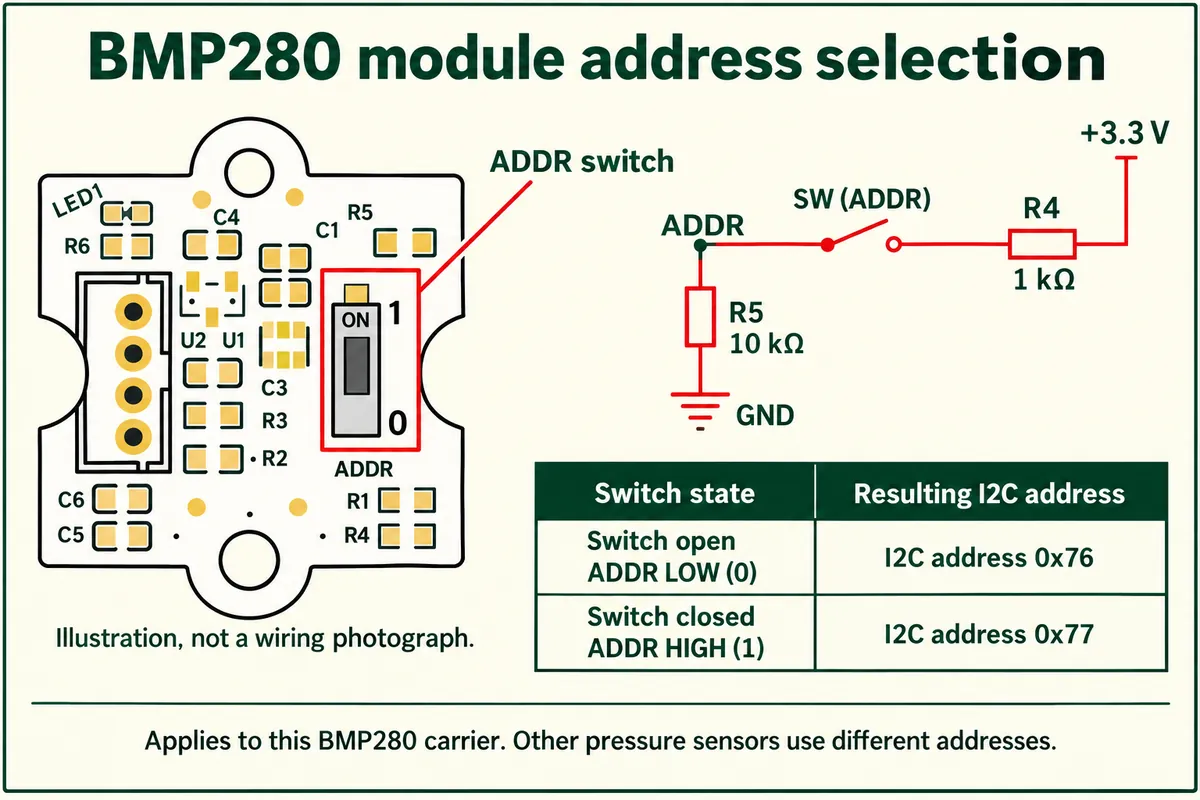
An I2C scan tells you which addresses respond. It is a useful first check, not proof of the sensor model. The BMP581 responded at 0x47. Bosch's BMP581 datasheet, section 5.6 gives 0x46 or 0x47, depending on the address pin; the 0x76/0x77 pair belongs to a different part and should not guide this setup.
Check the carrier schematic as well as the chip name. A module may accept a supply voltage through its regulator while keeping the sensor and communication pins at a lower voltage. A connector marked 5 V is not evidence that the bare sensor or its data pins tolerate 5 V.
Separate setup from measurement
The BMP581 program scanned the bus, initialized the driver and printed identification, status and configuration: address 0x47, chip ID 0x50 and revision 0x32. It then read temperature alone, switched to temperature plus pressure, and finally demonstrated on-demand measurements. That sequence exposes more than a single final number. One detail: it printed core_rdy: False while its own summary said normal, so treat that summary as the program's interpretation, not a health diagnosis.
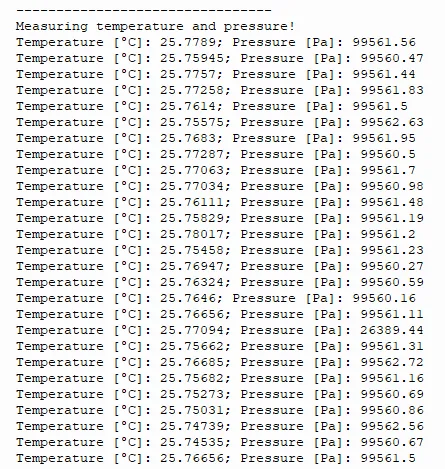
In the combined capture, pressure values sit around 99,561 Pa, which is about 995.61 hPa or 99.561 kPa. Those are three ways of writing the same pressure, not three levels of accuracy. One line in the same capture reads 26,389 Pa, far from its neighbors. Whatever caused it, a product should be able to flag or reject a sample like that rather than draw it on a trend chart.
The example checks whether data is ready before reading it. In the on-demand run, an initial "No data to read!" was followed by values. A product interface should distinguish "waiting for a fresh reading" from a measured zero, and stale data should never be presented as current.
Check units before comparing modules
The ICP-10111 run printed values near 112,680 followed by the label KPa, but the driver's conversion works in pascals. The value must not be read as 112,680 kPa, and relabeling it would still not prove the underlying number is accurate. The capture was taken in NORMAL mode only, so it says nothing about noise or power differences between modes.
The MPL3115A2 example reads pressure mode and altitude mode in turn and deliberately requests the wrong quantity to show the exception handling. Its pressure function already returns pascals, yet the example divides that result by 4000 and labels it kPa. Converting pascals to kPa calls for division by 1000, so the printed 24.97 kPa is not a usable environmental reading. A heading in that example calls a loop "long-term monitoring", but it runs for ten seconds with about two seconds between readings. That demonstrates repeated output, not long-term stability.
For an honest module comparison, record the actual settings, timestamps and raw output under the same conditions instead of ranking modules from isolated console captures.
Test the display at its intended location
Once the measurement path is credible, install the display at a fixed location and log timestamps, pressure, temperature and configuration through startup and normal operation. Keep failed or unavailable readings identifiable. A stable-looking number that repeats an old sample is not a fresh measurement. We have not run this complete log yet.
Compare pressure at the sensor against an appropriate local reference, or sea-level-adjusted pressure against a weather service's equivalent quantity. Record the reference location, time and reporting convention. A nearby weather report is useful context, but it is not a calibration instrument beside your sensor. Decide what the interface should show when external information is unavailable or outdated.
Repeat the test after the sensor goes into its enclosure. Air access to the sensor opening and nearby heat sources can change what worked on the bench.
Keep the first product promise modest: show the chosen pressure quantity and its history reliably. Forecasting is a further feature to evaluate, and these read-and-print runs do not establish it.