
A number changing on a screen tells you that a sensor or control is connected. It is less helpful when someone says the prototype occasionally jumps, hesitates or misses part of a movement. For a team preparing its first user test, a short graph and a saved data file make that conversation much more concrete.
You do not need a custom dashboard to start. On our bench we read a physical control with a MicroPython board, sent its value over a serial connection, and plotted it with SerialPlot. Then we saved the received values to CSV, a plain table another person can open and inspect. That lets the team discuss what happened before committing to the final interface.
We used two controls in separate runs: a rotary potentiometer for the plotted trace, and a slide potentiometer in a separate live recording. They are not one continuous test of the same assembly.
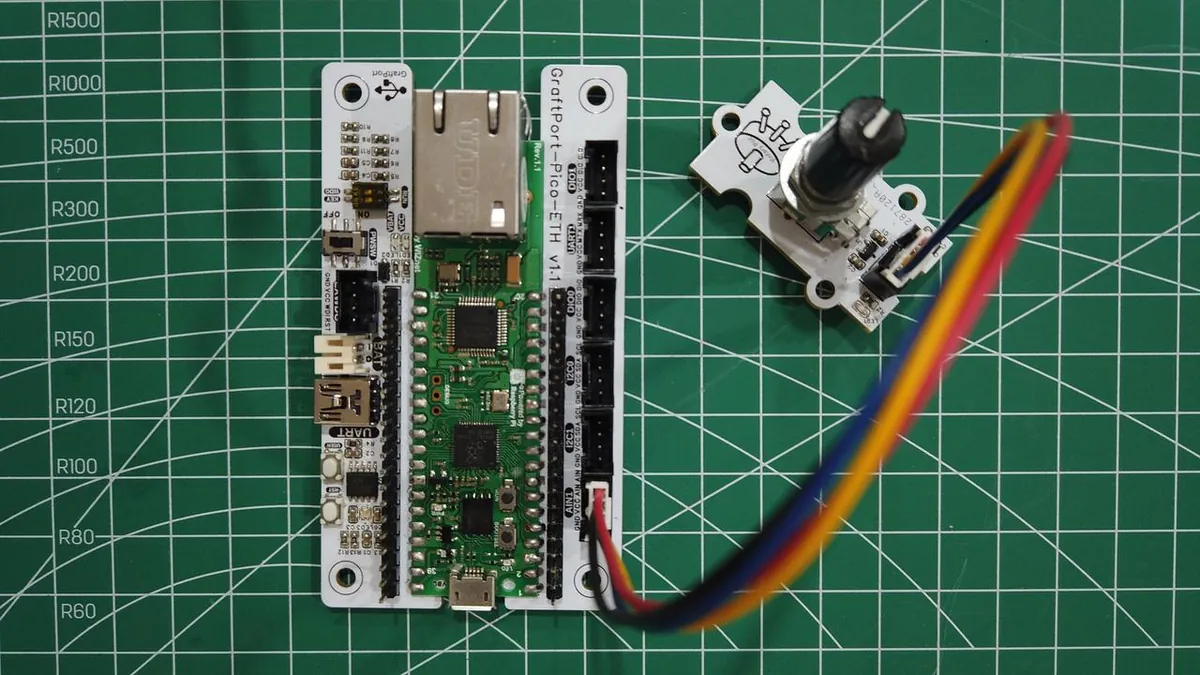
Begin with an input you can move deliberately
The setup used a GraftSense RK09L rotary potentiometer connected to a carrier board. A potentiometer is an adjustable resistor; used as a voltage divider, its moving contact supplies a voltage that changes as you turn the shaft. The ADC converts that voltage into a number.
The program selected ADC2 on GP28. It also configured PWM on GP25 to change an LED's brightness, and UART0 on GP0 and GP1 to send values to the PC. These are our assignments, not a universal connection plan for every Pico or Pico 2 board. Confirm your carrier's connector mapping and keep the input voltage within your board's allowed range.
The serial data path is separate from the interactive MicroPython console. Our console printed a descriptive sentence, while UART0 sent only a number followed by a line ending. If you open the wrong PC port, you may see readable text and still be looking at the wrong data stream.
Make the plotted stream easy to recognize
The plot only needs one short line per sample:
uart.write("{:.2f}\r\n".format(value))
That line carries a voltage estimate rounded to two decimal places. Do not prepend the console's descriptive message to this stream and expect the same parser settings to work. SerialPlot handles several input formats, but sender and receiver must agree. Its project repository lists ASCII and CSV among them.
In SerialPlot's Port tab, choose the port connected to the UART adapter, set 115200 baud, eight data bits, no parity and one stop bit, then open the port. Port numbers belong to your PC. For an external adapter, board TX connects to adapter RX, the grounds must be connected, and the logic levels must be compatible.
Under Data Format, select ASCII. This example sends one number per line, so there is no second channel to separate. If you later add another measurement, define the column order and delimiter together rather than relying on what the plotting program happens to infer. When there is no waveform at all, check in order: the transmitted format, wiring, port settings and parser configuration. That is a setup problem, not a reason to redesign the sensor.
Read the graph without giving it more meaning than it has
Our sampling code reads ADC.read_u16(), multiplies by 3.3 / 65535, and schedules a callback from a timer. It requests 100 updates per second, a 10 ms timer period. (One of our notes said 10 Hz, which disagrees with the code.) Treat 100 Hz as the requested rate, not a measured guarantee of evenly spaced samples reaching the PC.
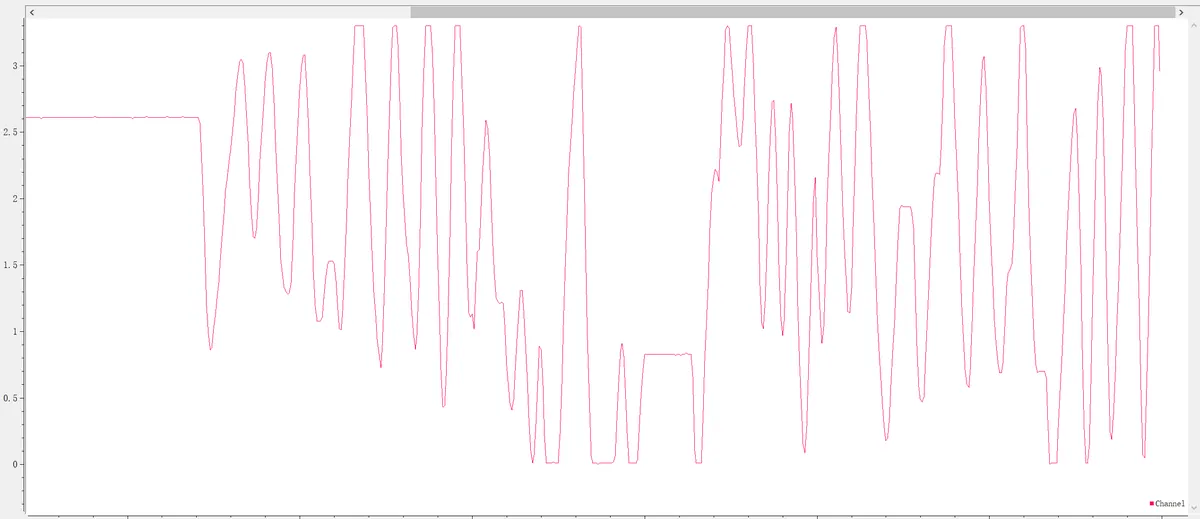
MicroPython's ADC reference defines read_u16() as a scaled reading from 0 to 65535. That range does not mean sixteen bits of physical resolution. Multiplying by an assumed 3.3 V reference does not calibrate the voltage either. The graph is useful for following movement long before it supports precise measurement claims.
For a first check, move slowly from one end to the other, hold still at several positions, then move quickly. Watch for flat regions, sudden changes and movement while the control is stationary. Our trace does not identify any peak as a fault, and we did not run a controlled noise test.
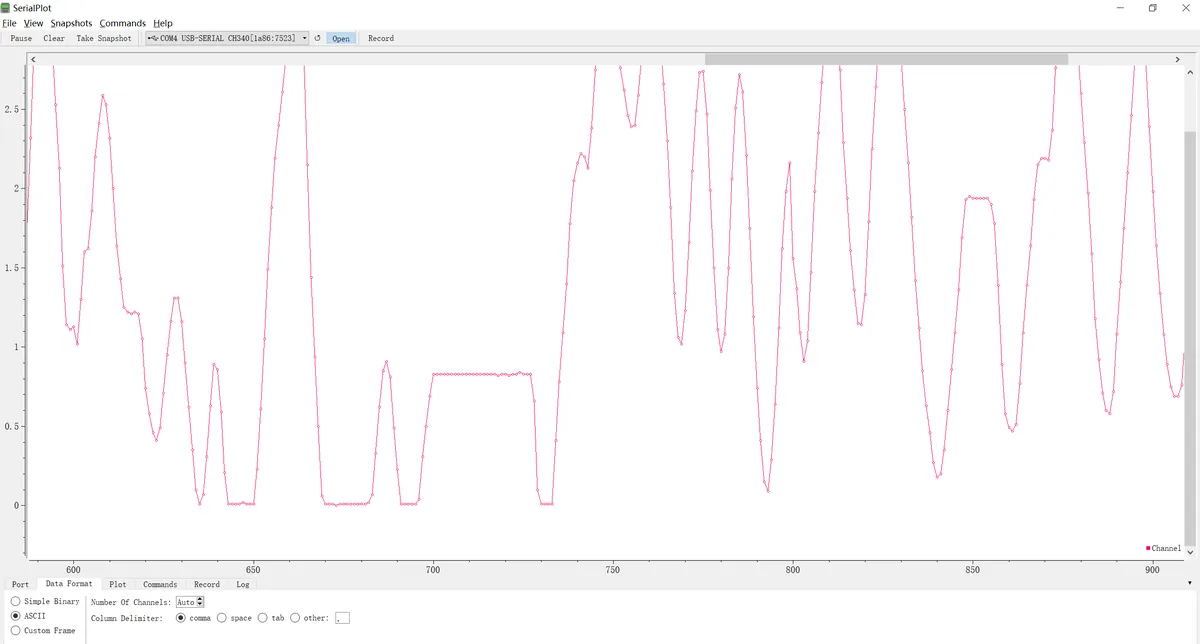
Selecting a region enlarges it and shows individual samples. Zooming helps inspect what was received. It cannot recover variation removed by rounding to two decimals, or samples that never arrived.
Our timer callback also printed to the console, updated the PWM output and wrote to the UART. Raising the requested rate raises that work too. Before using the same arrangement for faster signals, check the callback backlog and actual sample timing. This setup suits a manually moved control; it is not a validated high-speed acquisition system.
Save numbers that somebody else can use
The need to keep the data is familiar. In a December 2018 Arduino forum thread, a user wanted to export a graph for analysis. The discussion separates a picture of the plot from the underlying values, and that distinction still matters when a prototype changes hands.
In SerialPlot, open Record, choose a new CSV filename and start recording. Enable a header if you want the file to name the channel, then stop recording when the run is finished. Check what happens when the display is paused or the port closes: a paused picture and a stopped recording are not necessarily the same state.
Our saved table held a single column of values (around 0.67 in the section we viewed). A single column has no timestamps, so on its own it cannot tell you how long the run lasted or whether samples were missed.
For your own handoff, keep the CSV with:
- the firmware version, board and control used;
- units and port settings;
- a short description of the movement performed.
If timing matters, add a device-side sequence number or timestamp in a deliberately defined format. A screenshot of the interesting region is a useful companion to the data, not a substitute for it.
The next useful deliverable is a repeatable observation: what the person did, what the prototype reported, and what response they expected. Once that is clear, a graph helps decide whether the next change belongs in the wiring, the input processing or the interface.