
If you are building an interactive object or a wearable concept, a changing heart-rate number can make the prototype feel nearly finished. But a sensor can communicate perfectly while the number on screen is wrong. The next useful milestone is a repeatable optical signal, with a clear explanation of how software turns it into a result.
On our bench we ran two experiments with GraftSense MAX30102 and MAX30100 modules on a GraftPort-RP2040 board under MicroPython. Both produced real terminal output. Both also exposed problems worth resolving before you design a finger rest, a wrist enclosure or a user-facing display.
Start with the place where the finger meets the board
These modules shine red and infrared light into tissue and detect the light that comes back. The small changing part of that signal can contain the pulse. Keeping the optical window in a consistent position is therefore part of the measurement, not a cosmetic enclosure detail.
The MAX30100 board has a marked finger-pad position over the sensor (U1). Holding still and keeping strong light off the sensing area both matter. A future housing should make that positioning comfortable and repeatable; asking someone to press harder whenever a result looks wrong is not a useful product interaction.
This problem shows up in public projects too. In a June 2019 Arduino discussion, a builder reported implausible values and readings with no finger present, then tried a different controller. Moving to a larger processor does not, by itself, settle whether the optical measurement is sound.
Analog Devices' explanation of optical and mechanical coupling gives another reason to test the housing early: a changing gap between skin and sensor can introduce variation unrelated to the pulse. The product must control that contact, not simply fit around the PCB.
Wiring, addresses and two different drivers
Both experiments used I2C0 on the GraftPort-RP2040: GP4 for SDA and GP5 for SCL, with power and ground on the four-wire module connector. The application uses I2C address 0x57. That is the seven-bit address; the 0xAE and 0xAF values in protocol descriptions include the write/read bit and are not what you pass to the usual MicroPython address argument.
The modules include their own supporting power circuitry. Check the actual module schematic before connecting another board: the supply requirement of a bare sensor chip is different from the input of a regulated breakout. The two sensor models also have different register maps and drivers, even though they share an address and a similar name.
We also hit a packaging trap. The package listing we installed from showed a MAX30100 driver while the MAX30102 command named a different package, and the MAX30102 archive contained max30102.py, heart_rate_monitor.py and circular_buffer.py but not the heartratemonitor module the example imported. Resolve mismatches like that before treating any example as copy-and-run.
What the MAX30102 recording actually shows
The example configured a 400-sample-per-second sensor rate and averaged eight samples, intending 50 output samples per second. It prepared a 150-sample window, then polled the sensor, waited half a second, took one stored red/infrared pair and read the chip temperature. Those settings do not establish that 50 samples per second reach the calculation.
In the driver, check() returns inside its sample-reading loop after the first available sample. Reading temperature adds a 100 ms wait, and the heart-rate helper timestamps samples when they are added to it, not when they were measured. Together, these details mean the data path and timing need correction before the calculated rate can be trusted. Changing a variable named sample_rate will not repair the sequence.
The terminal showed changing RED, IR and TEMP values, repeated "not enough data" messages and a displayed Heart Rate: 5 BPM. That is useful debugging evidence. It is not a successful heart-rate measurement. The temperature value is the sensor's die temperature, not body temperature.
The next firmware experiment should record a continuous, timestamped optical sequence, drain available samples correctly, and keep slow display or temperature work out of the acquisition path. Preserve invalid-data states instead of printing a plausible-looking number whenever the signal is incomplete. We have not run that corrected version yet.
The MAX30100 example teaches a different limit
The second experiment enabled red/infrared mode, read both channels and printed the registers every 200 ms. Its output included a value called har, computed as 100 minus 25 times the instantaneous red/infrared ratio.
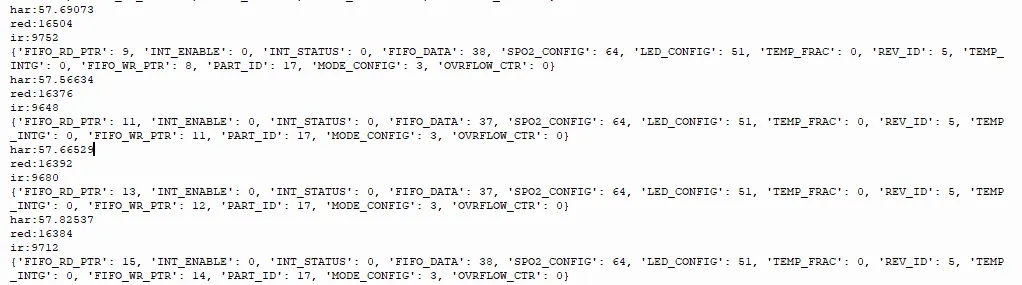
That expression uses the raw channel ratio. It does not separate the pulsating signal from its background and is not a validated oxygen-saturation calculation. Keep the raw red and infrared values for investigation, but do not put har on a customer screen as SpO2.
Analog Devices' SpO2 measurement guide, published in March 2019, describes the changing and background components of the optical signals and explains why the finished optical arrangement affects calibration. That is a separate engineering task from getting two sensor registers to print. Neither of our experiments establishes medical measurement accuracy.
Give the next prototype a smaller, testable job
For an early interaction prototype, ask for a consistent raw pulse signal and a reliable indication of whether usable contact is present. Compare repeated placements using the intended finger support or enclosure, with the same settings and a saved signal log. Observe what happens when the finger is removed, the device moves or the lighting changes. Do not interpret the resulting numbers as health information.
Once acquisition and contact are stable, an engineer can choose an appropriate algorithm and define its validation requirements. If the goal is a health measurement product, that work goes well beyond these bench demonstrations. A photo of the contact arrangement, the exact driver version and a short raw-data recording give that review something concrete to assess, which is more useful than a screenshot of a single calculated number.