
You have connected a gas-sensor module, watched its indicator change and seen numbers appear on the screen. For an environmental-sensing prototype, that is useful progress. But if the next version will display a concentration, you need to establish what connects those numbers to the gas you want to measure.
The small adjustment screw on an MQ module does not settle that question. It moves the point at which the digital output switches. A concentration reading needs a measured relationship between the sensor response and known conditions. Those are separate jobs, even when both get called calibration.
On our bench we ran two experiments on a GraftPort-RP2040 controller board under MicroPython. One read an MQ module through an analog input and a digital threshold signal. The other read three analog channels from a MiCS-6814 module. Here is what they showed, and the evidence needed to take either further.
First separate the two outputs on the MQ board
GP26 read the MQ carrier's analog output, and GP19 received its digital comparison signal. An analog-to-digital converter (ADC) turns the measured voltage into a number the program can use. The digital signal only says which side of a selected threshold the circuit is on.
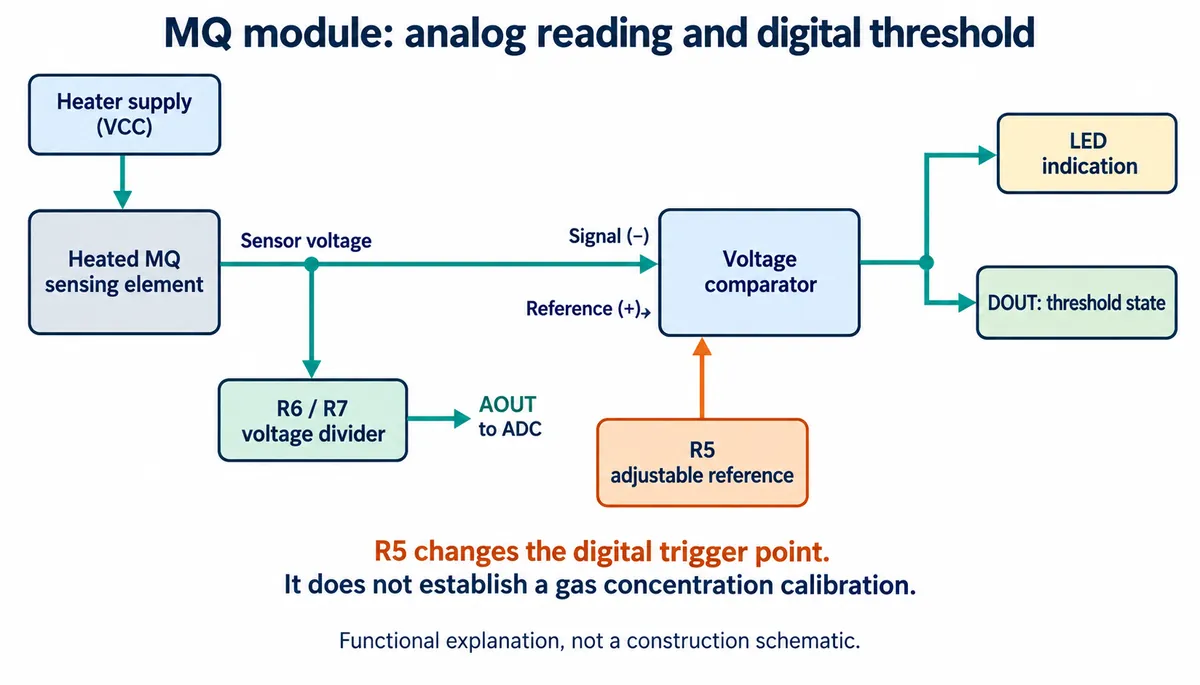
Turning R5 changes the digital switching point. It does not supply a known gas concentration to calibrate the analog reading against. We adjusted R5 while watching the board's indicator LED and stopped near the on/off transition. That sets a local threshold for that setup in its current conditions. It does not set a threshold in ppm (parts per million), or show that the same adjustment will behave the same way on another module.
Before reproducing the connection, check the actual probe, carrier version, heater supply and ADC voltage limits. MQ probes differ, and our test selected an MQ2 software profile. A shared package shape does not mean every probe has the same heating or conversion requirements.
Follow the number from voltage to the console
The program printed a voltage, then took five readings with a 200 ms delay after each, evaluated the selected conversion and printed a value labeled "Gas concentration." The main loop then paused two seconds. An interrupt callback separately printed a voltage whenever the digital input changed state.
In the driver we used, the MQ2 profile applies a polynomial directly to voltage: 100 × V − 20 × V². Substituting 1.4 V gives 100.8. That explains how a plausible-looking number near 100 can appear on screen. It does not show that the surrounding gas concentration was 100.8 ppm.
The driver's own documentation says the coefficients need calibration for the actual environment, and we have no measured dataset establishing them for this probe and gas. The driver also accepts a load-resistance value, but the polynomial does not use it to compute a sensor-resistance ratio. Choosing a familiar sensor name in software does not verify the conversion behind it.
On the bench the readings responded when we handled the module, but we did not use a known test-gas concentration or a reference instrument. When you show a prototype to someone else, keep that distinction: a visible response is evidence of behavior; an absolute measurement needs more.
Builders run into this often. In an Arduino Forum discussion from April 2019, a user moved from reading an analog output to asking which calibration method to use and whether code for another MQ model could produce ppm. The technical basis for calibration should come from the sensor documentation and a suitable measurement procedure.
Three analog channels still need their own interpretation
The MiCS-6814 test connected the three carrier outputs to GP26, GP27 and GP28 and read them once per loop with a one-second pause. The output reported ohms for the oxidizing, reducing and ammonia-related channels. Those are resistance values, not three verified gas concentrations. The driver also keeps raw ADC and voltage fields, which help you check how a calculated value was obtained.
There is a configuration gap to resolve before using those resistances quantitatively. The driver defaults to a single 56 kΩ load-resistance setting, while the carrier schematic shows different resistors on the three channels. The channel names in our saved output also differ from those the current driver package prints. Match board, wiring and software version before treating the output as a reproducible resistance measurement.
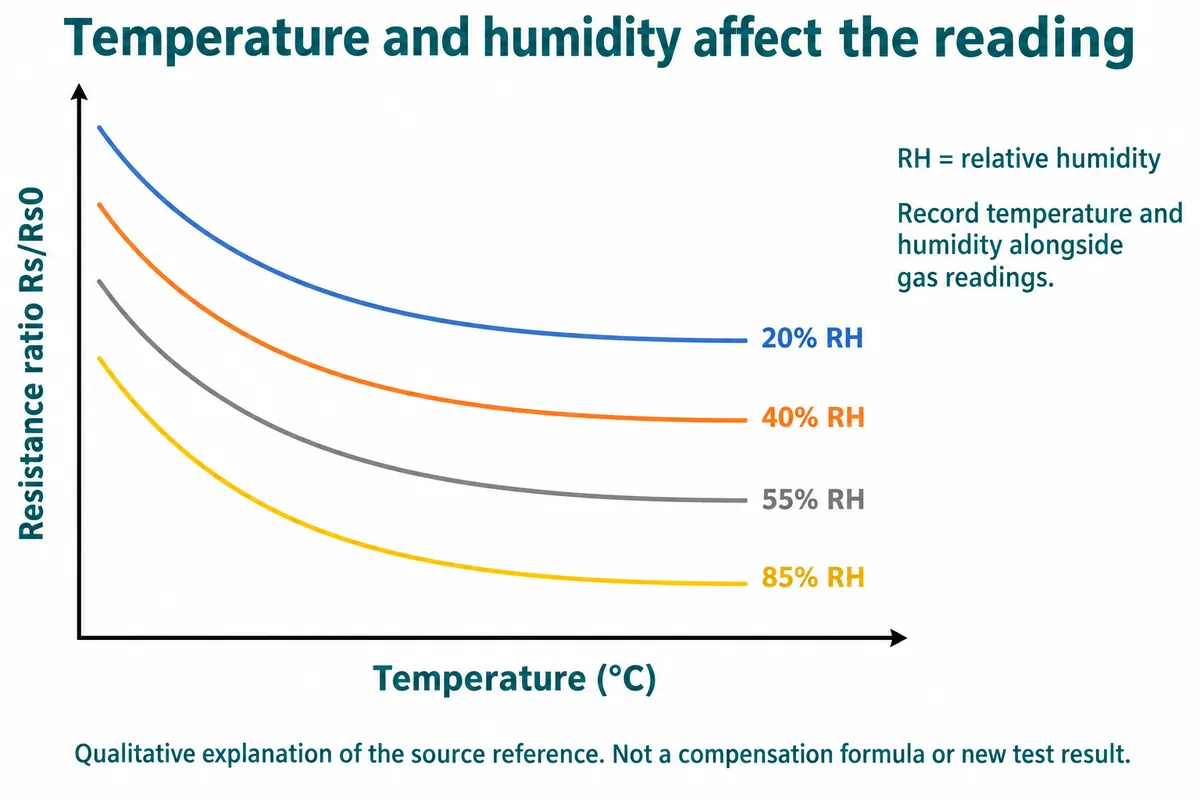
Even a correctly calculated resistance is only part of the measurement. SGX's application note on metal-oxide gas sensors explains that individual sensor responses vary and that converting to concentration requires calibration with the target gas. It also covers environmental effects and cross-sensitivity. Three sensing elements do not by themselves mean a prototype can identify and quantify three gases in an unknown mixture.
Turn the calibration idea into a recorded experiment
A calibration workflow records temperature, humidity, sensor output and known concentration together, then fits a conversion on a computer. We sketched that workflow and a logging screen, along with file-reading, preprocessing and polynomial-fitting code. That is a plan for the data record. We do not have the full dataset, final coefficients or independent validation results needed to establish accuracy.
For a useful next experiment:
- decide the target gas, concentration range and conditions that matter to the application;
- work with an appropriate test setup or qualified testing partner to get known reference conditions;
- record probe and carrier identity, heater operation, settling time, raw ADC value, voltage, temperature, humidity and reference concentration together.
Without that, a later graph may be impossible to interpret or reproduce.
Check a fitted curve against measurements that were not used to fit it. Look at errors across the intended range and conditions, including near the decision threshold. Keep the raw measurements and record why any samples were excluded. A smooth curve or a small training error does not tell you how the assembled prototype will behave in a different room or enclosure.
Choose the next milestone your prototype actually needs
For an early interaction demo, a relative response and a clearly labeled change may be enough. For a product that promises a numerical concentration, the next milestone is a validated conversion and a statement of its operating limits. If a reading will drive a protective alarm, these bench tests say nothing about the reliability or suitability of the finished device.
The useful outcome is a clearer development brief: which response the hardware provides, what the software calculates, and what has actually been compared with a known reference. With that, your team can decide whether to continue with this sensing approach, get more suitable measurement hardware, or change what the first prototype promises.