
You have a small ECG module connected to your controller, and a line is moving across the screen. For an educational prototype or an early biosignal interface, it feels like the difficult part is over. The next question is less obvious: which parts of that display can you trust enough to build the rest of the experience around?
A smoother line can be easier to show without being a better record of the signal. That matters when a designer wants a responsive animation, a developer wants a stable number, and the person reviewing the electronics needs to see what the filtering removed. Keeping those views connected is more useful than choosing the prettiest trace.
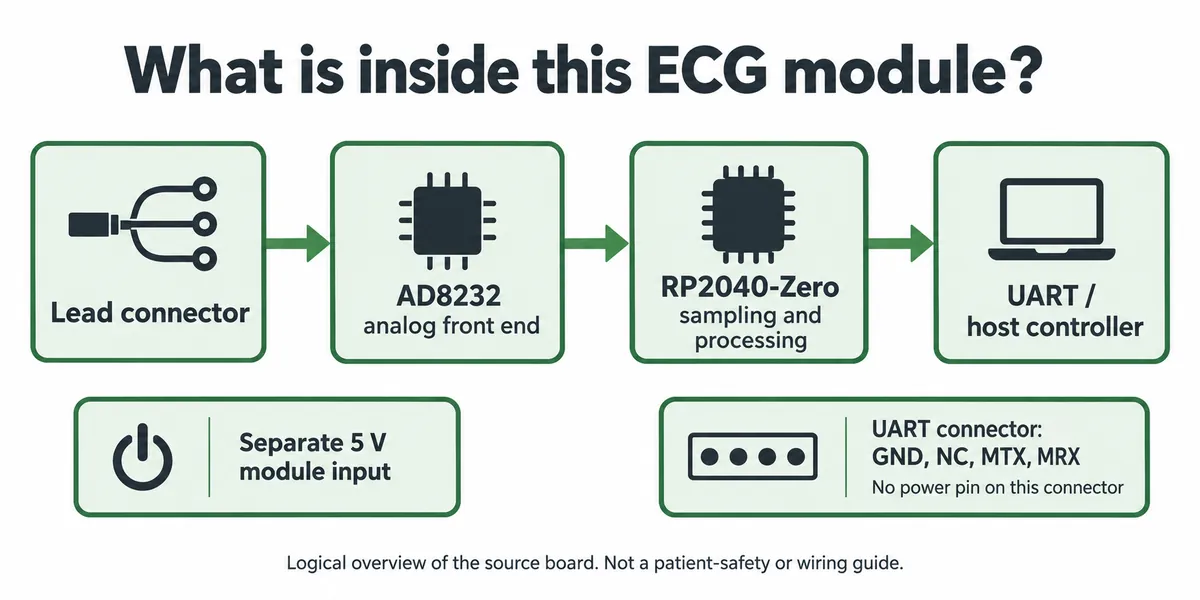
On our bench we worked through a concrete example: a GraftSense ECG module with an AD8232 front end and an RP2040-Zero doing local processing, read by a second controller that forwarded values to SerialPlot on a computer. This note follows that signal path. A working display is a starting point for verification, not evidence of medical accuracy, and nothing here is a clinically validated device.
Decide what the display is meant to preserve
This is a familiar difficulty in first ECG projects. In a December 2025 Arduino forum discussion, a builder had followed an AD8232 guide but was concerned that the waveform did not resemble the expected shape. A copied circuit and a moving plot did not answer the real question: what should the output look like, and why?
No single filter setting answers every version of that question. Analog Devices distinguishes between finding beats and preserving more of the waveform. Its AD8232 data sheet, pages 27 and 28, gives different reference circuits for those purposes, and the narrower heart-rate example changes the waveform's shape. Those are chip application examples, not measurements of this module.
Define the decision before adjusting the picture. Are you checking that the electronics transport a signal, exploring how an interface responds, or evaluating whether a particular feature survives processing? Our bench run is useful for the first two. It does not contain the comparison measurements needed for any diagnostic claim.
Follow the signal through the actual prototype
The module brings together jobs that a bare analog breakout would leave to the host. The AD8232 conditions an analog input; the RP2040-Zero runs the device firmware; the external controller receives values over UART. The firmware provides raw and filtered values, lead status and a heart-rate output.
That arrangement makes the host program simpler, but the host is receiving a processed module output. A field called "raw" should not be treated as an unaltered, calibrated voltage at the electrodes. You still need to establish its scale and where in the chain it was taken; our records do not settle that.
Our bench assembly used a battery supply arrangement, a USB connection to the computer and loose leads. That is a bench setup, not a reviewed arrangement for connecting a person: the complete power and computer connection matters. Analog Devices' AD8232 evaluation-board guide recommends an ECG signal source for evaluation and warns that the board's input resistors alone do not provide comprehensive patient protection. Use a signal source while the complete system is under review.
Keep the firmware and host program together
Setup took two separate software installations: a UF2 firmware file on the module's RP2040, then device files uploaded through Thonny, and a separate driver and program on the host controller. They are not one script that makes every version of the module interchangeable.
That matters as soon as the plot looks different after an update. The device controls what it produces; the host controls what it requests, decodes and forwards. Record the device firmware, the host driver and the display settings together. Otherwise a changed picture may be blamed on the sensor when the actual difference is in decoding or scaling.
Our own package had a version boundary of exactly this kind. The device code header names MicroPython 1.24, the host example names 1.23, and the filter implementation ships as compiled files. We cannot claim every included file reproduces every screenshot, so we keep that uncertainty with the project rather than treating the bundle as a tested release.
Verify one response before trusting the stream
A serial-terminal capture gives a useful small check. It shows a request followed by this response:
AA 55 01 02 00 46 48 0D 0A
The host parser treats 01 as the command identifier, 02 as the payload length and 00 46 as the payload, which it decodes as the integer 70. The checksum is an eight-bit sum of header, command, length and payload, giving 48. That differs from the XOR description in the protocol table we had. An offline check of the parser with a simulated serial input accepted the frame. It did not exercise the module hardware, and it says nothing about whether 70 is an accurate heart rate.
Resolve a disagreement like that by pairing the intended firmware with its matching driver. Do not combine a protocol table from one revision with a parser from another because both say AD8232. Once one response is understood, check the continuous stream separately: arrival timing, missing frames, and whether the host can tell a fresh value from a cached one. Lead status and heart-rate fields printed by the program (values such as 72 and 62) are displayed software fields, not results checked against a reference.
Reconstruct what the two plotted lines represent
The host program received the module output on UART1 at 115200 baud. It read the raw and filtered properties, requested lead status, read heart rate, and sent two comma-separated values through UART0 to SerialPlot, configured for 115200 baud, 8N1 and comma-separated ASCII. That separates the module connection from the plotting connection.
The main loop sleeps 10 ms, but that does not prove a new measurement arrived every 10 ms. The driver parses incoming data asynchronously, and its query method can return the value already held in memory. In an interface, a repeated old value can look reassuringly stable. A timestamp or "last received" indicator makes the difference visible; a smooth plot does not.
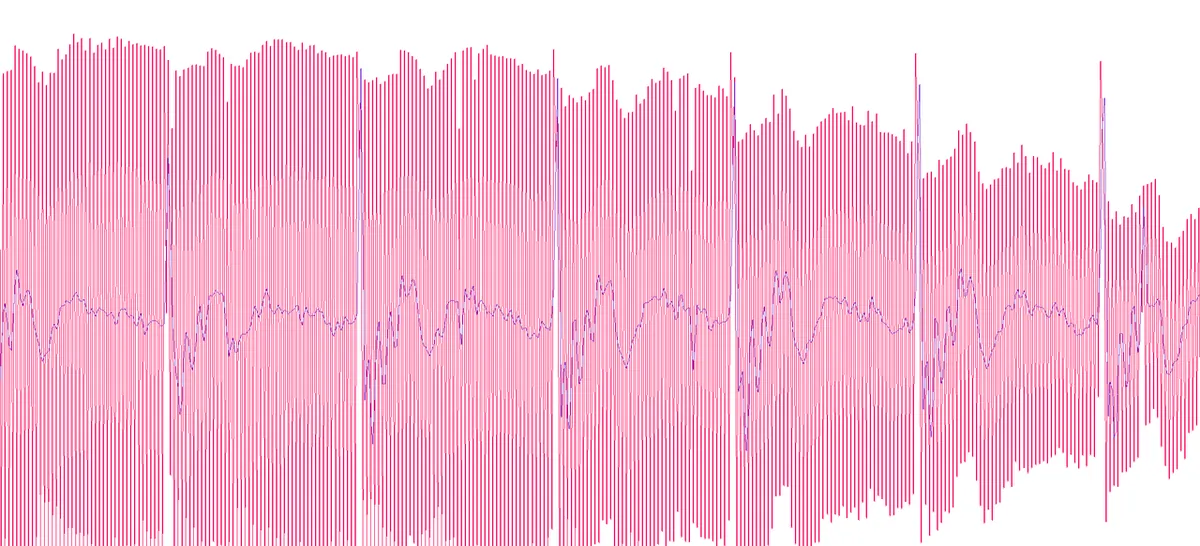
The saved result shows a much more jagged trace alongside a smoother one. It supports the observation that the outputs differ. It does not identify every spike as a particular interference frequency, or show that the smoother trace preserves the features another application needs. The plotting window also applies its own display scaling, and we did not record the conversion from transmitted numbers to the vertical axis. Answering those questions needs the underlying samples, timing information and a known input.
Make the next demonstration easier to explain
For the next version, keep the unprocessed and processed values together, and add enough context to tell whether the display is current: receive time, lead-status interpretation, firmware and driver revision, and the scaling applied before plotting. These are proposed additions; we have not demonstrated them yet. A known signal source then lets the team compare what went in with what each stage displayed.
That gives each person a useful view of the same prototype. The designer can evaluate the interface's response; the developer can spot stale data; the engineer can compare processing against an input that is understood. You can still choose a filtered trace for the user-facing display while keeping the evidence needed to explain it.