
You slide a colored card over a sensor and a name appears on screen. That is enough to demonstrate an idea for an educational toy or an interactive exhibit. Before another person tries it, though, the same card needs to give a consistent result when it is removed, replaced or tilted slightly.
More sensor channels do not solve that by themselves. The light source, sample position and measurement settings all affect the numbers. For a team building its first optical interaction, a repeatable way to present the sample can matter as much as the code that names the color.
On our bench we connected a GraftSense AS7341 spectral sensor module to an RP2040 controller, read raw channel values, and held printed color cards over it with a simple classification example running. Here is what that showed and where the limits are.
Start by keeping the raw measurements
The AS7341 measures light through several optical channels. Our software read F1 to F8, covering different parts of the visible spectrum, plus clear and near-infrared readings in the selected channel groups. These are sensor counts, not screen RGB values or a material identity.
The module connected to a GraftPort-RP2040 over I2C0, with SDA on GP4 and SCL on GP5, a 100 kHz bus and address 0x39. Use the module's actual supply and level-shifting arrangement; the bare AS7341's supply requirement is different from a carrier board's input specification.
We used the MIT-licensed AS7341 MicroPython driver by Rob Hamerling. The test set ASTEP to 599 and ATIME to 29, giving a nominal integration time of about 50 ms per measurement cycle (the terminal reported 50.04 ms). It demonstrated an 8× gain setting and then switched to 16×. Recording these choices matters: counts taken at different gains or exposure times cannot be compared as if nothing changed.
The AS7341 datasheet from ams OSRAM documents the integration-time calculation and the six internal conversion channels in its SMUX and integration-time sections. Reading more than six optical channels takes multiple measurement cycles. We collected the first and second groups one after the other, so the sample and lighting have to stay steady across both.
What the color-card result does and does not show
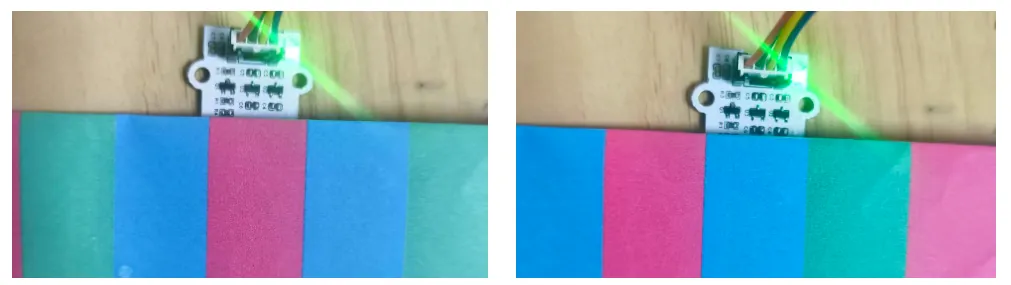
We moved from indoor ambient-light readings to placing printed color patches over the sensing area. That is a useful physical step: it ties the software output to something a person can handle.
The final output included "Red" and "Blue" labels. It also showed why raw data matters. Many channel values were only zero to three counts, yet the calculated RGB output included values above 255. The example divides weighted channel combinations by the largest channel value and scales them, which can turn tiny differences into large-looking numbers.
A label produced that way is an output of the example's rules, not evidence of calibrated color measurement. Clipping the numbers to the display range would make them easier to draw but would not recover measurement quality. First get a usable signal under consistent conditions, then judge whether the classes can be separated.
Others hit the same problem. In a July 2023 DFRobot forum thread, a builder testing printed papers reported yellow/green and red/orange mix-ups. That is a different setup and says nothing about the cause of our results, but it shows why choosing the printed patches and controlling how they are measured belong in the test plan.
Make the first comparison deliberately simple
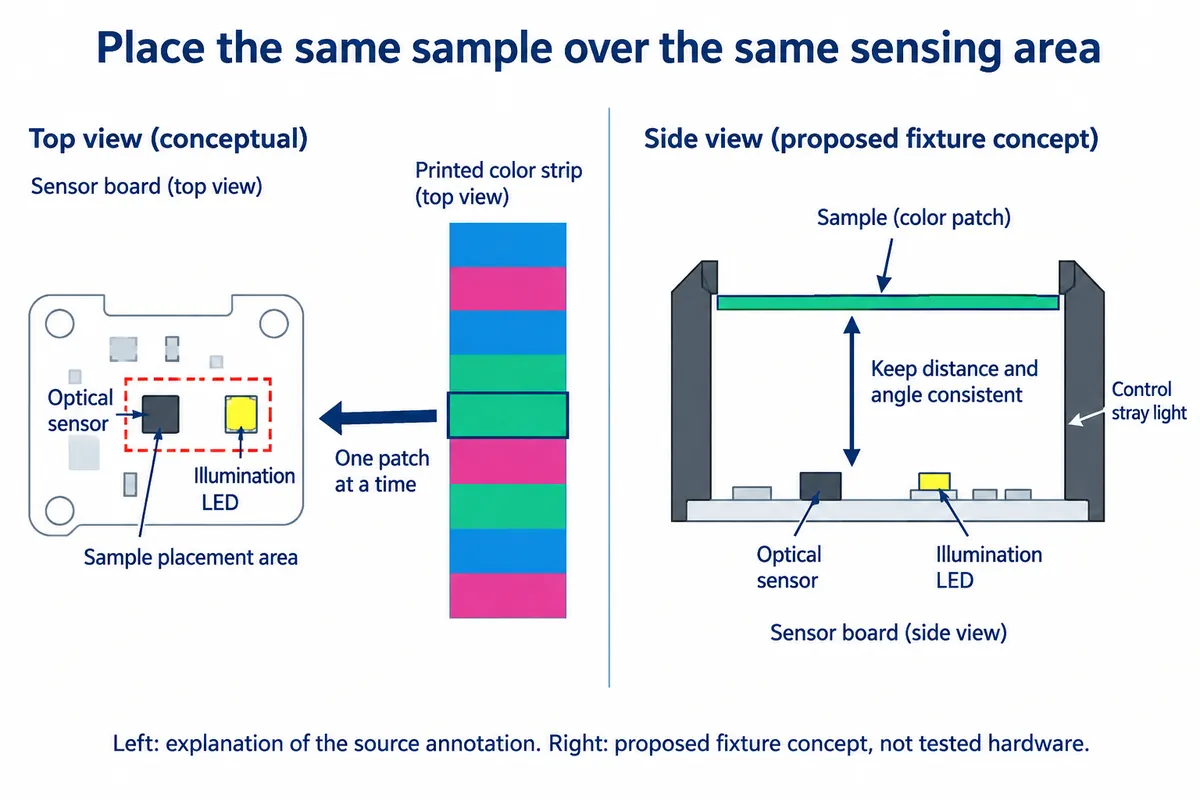
Choose a small set of the actual samples the product must distinguish. Keep illumination, distance, angle, gain and integration time fixed while collecting repeated readings. Remove and replace each sample between some measurements, so the test includes the way a person will actually use the object.
Store the two channel groups separately before combining them. With the driver already configured, our acquisition order was:
sensor.start_measure("F1F4CN")
first_group = sensor.get_spectral_data()

sensor.start_measure("F5F8CN")
second_group = sensor.get_spectral_data()
The clear readings in both groups help you notice a large change between acquisitions, though they are not a complete quality check. Also watch for readings near the noise floor or saturation, and record the illumination state. If you change gain or lighting to improve the signal, start a new comparison set with those settings recorded.
Our program also exercised LED-current settings, GPIO configuration and interrupt controls separately. That confirms configuration, but it does not show the color-card capture used a controlled illumination sequence; the LED demonstration ended by switching the LED off, and our captures came from different program stages rather than one continuous run. Next time, record the illumination state in every saved reading and keep it stable across both channel groups.
Let the samples decide how much processing you need
With repeated measurements in hand, compare the variation within one sample with the separation between samples. If the same card produces a wide range, improve placement and illumination first. If two different cards still look alike under controlled conditions, more classification code may not give the product a dependable distinction.
For an exhibit that recognizes a few supplied cards, a classifier trained and checked on those cards may be enough. Matching arbitrary paint, fabric or printed colors needs a different level of calibration and validation. ams OSRAM provides separate spectral calibration and optical-design resources; a weighted RGB formula is not a substitute for that work.
The illumination source, the reflective sample and the sensor form one measurement system. A useful next prototype combines a stable sample holder, explicit measurement settings and an honest "not recognized" result when the evidence is weak. It should not confidently label an empty slot or a badly positioned card just because one channel happened to be the largest.