
You are choosing a sensor for an outdoor accessory or a teaching device. Several modules promise UV readings, and each can make numbers appear in a terminal. How do you decide which one gives your software the information it needs?
Start by asking what each number represents. A voltage, a count, a lux value and a calculated UV Index are different outputs. Their size alone cannot tell you which module is more sensitive or more accurate.
On our bench we connected four GraftSense UV and light modules to a GraftPort-RP2040 controller board running MicroPython and lit each with a handheld lamp. These were separate demonstrations, not a controlled comparison. They help you plan a comparison of your own; they do not pick a winning module or validate an outdoor product.
Give each output a name and a purpose
For a teaching activity, showing that a sensor responds when illumination changes may be enough for a first experiment. For a device that displays a UV Index, the conversion and the conditions under which it is valid also matter. Choose the intended output before designing a screen around a number from an example program.
Plausible-looking numbers are not proof that the setup works. In a June 2019 Arduino discussion, a beginner saw fixed, maximum-looking values from a Si1145 while it was connected to a digital port instead of the required I2C pins. Keep initialization messages, raw readings and physical connections together while testing.
| Module | Path into the controller | What our test program exposed |
|---|---|---|
| SI1145 | I2C, GP4/GP5 | A UV value, visible and infrared values, and a proximity value |
| VEML6075 | I2C, GP4/GP5 | Compensated UVA counts, a calculated UV Index, and integration time |
| LTR390UV | I2C, GP4/GP5 | Lux in ALS mode, followed by raw counts in UV mode |
| GUVA-S12SD | Analog input, GP26 | Voltage and an index label from a driver lookup table |
The table describes our test programs and drivers. Other libraries may use different units or calculations.
SI1145: keep the channels distinct
The SI1145 answered at address 0x60 with part ID 0x45, and the program printed four values every two seconds. Our driver reads the UV result from register 0x2C and divides it by 100. The visible, infrared and proximity outputs come from separate driver properties.
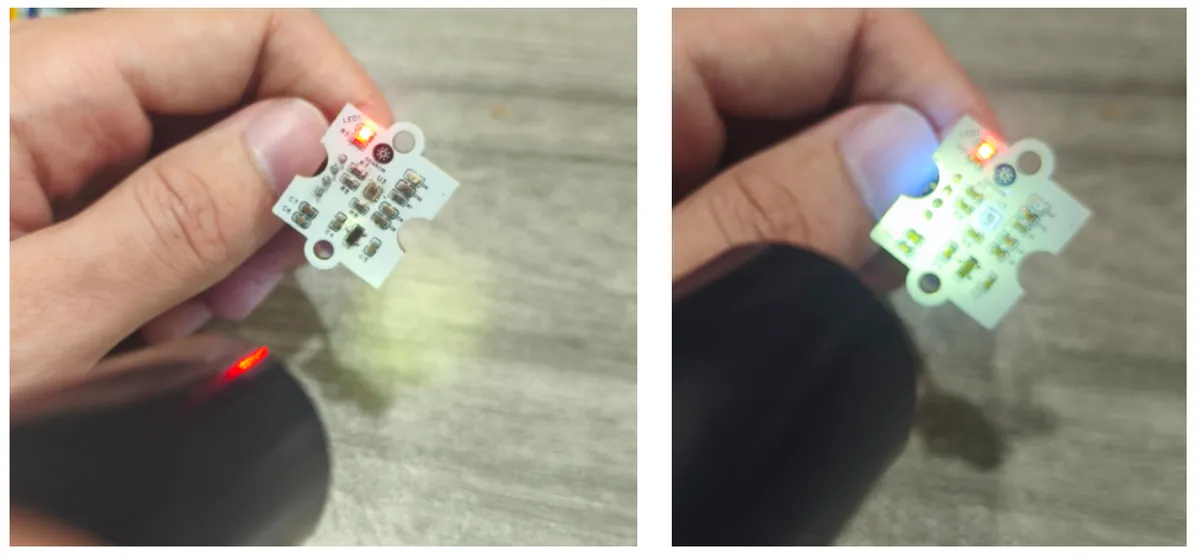
The values changed under the lamp. But the proximity value is not a distance in centimeters, and the visible output is not labeled lux by this program. Keep those distinctions on an engineering screen so the interface does not give a raw channel a more specific meaning than the test supports. The UV result was not compared with a reference instrument.
VEML6075: a calculated result depends on its settings
The VEML6075 used the same bus pins, answered at address 0x10, and printed UVA, UV Index and integration time.
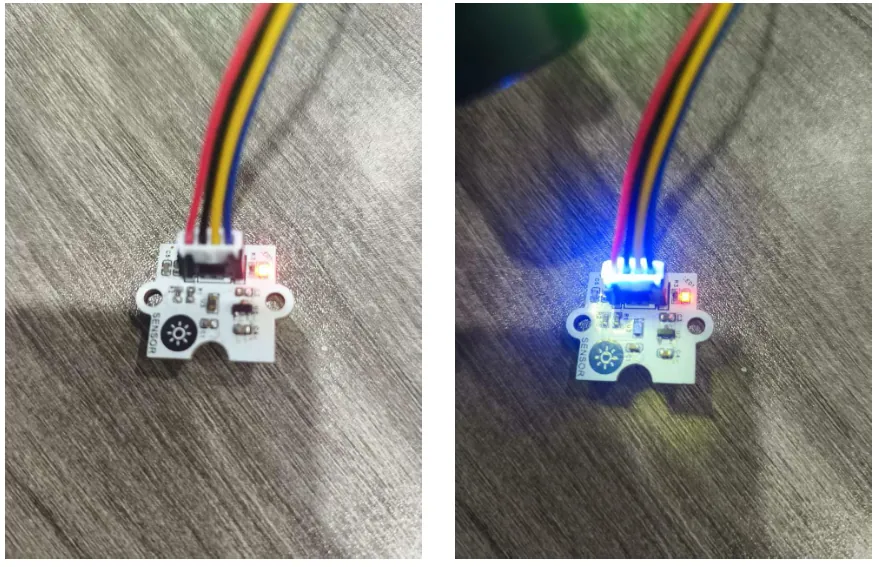
In our driver, the UVA property returns compensated counts. The UV Index property combines compensated UVA and UVB values with configured response coefficients; it does not simply rename the UVA number. Each property takes another reading, so two values printed side by side are not necessarily one simultaneous sample.
The terminal showed a 50 ms integration time and changing calculated values. Record that setting when you repeat the test. If you change integration time or other acquisition settings, check the conversion assumptions too; a larger count after a setting change is not automatically stronger illumination.
Vishay's application note on designing with the VEML6075 describes visible and infrared compensation and angular-response correction as parts of a UV Index sensing system. The sensor, the calculation and the optical arrangement have to be considered together, and a lamp test on an open module does not cover them for a finished assembly.
LTR390: check which mode produced the reading
The LTR390 initialized at address 0x53, reset, and started in ambient-light (ALS) mode. The program prints 1,000 lux readings before switching to UV mode, where the output is labeled raw.
The results we kept are from the ALS phase and show lux values, even though the module was also photographed under the UV lamp. They show ambient-light response. They do not show a calibrated UV Index or the later raw-UV phase.
When integrating a sensor like this, log the mode and acquisition settings with the data, and give the displayed quantity its actual unit. If your product needs both ambient-light and UV information, account for the mode change instead of treating the outputs as simultaneous.
GUVA-S12SD: follow the voltage through the software
The analog module connects to AIN0 on GP26, so the controller's ADC is part of the measurement path. Our driver averages ten ADC readings 5 ms apart and converts the average to voltage assuming a 3.3 V reference. On the module, the photodiode feeds LM358 analog stages; analyze the resistor network as drawn before assigning a total gain.
The driver then maps voltage bands to integer values from 0 to 11. It returns 0 below 227 mV and 11 at 1,170 mV or above. Those thresholds explain software behavior; our test does not show that the mapping describes sunlight in a real product.
Our terminal log contained repeated 3.300 V and 11.00 entries. Once the voltage and the lookup output reach their upper values, they cannot distinguish stronger inputs. The test program also read voltage and index through separate sampling calls, so one printed line can hold values from different moments. Do not fit a calibration curve to those two columns.
To reproduce this, the sensor-reading program creates the sensor object on pin 26, reads voltage and index, prints them and waits 0.2 seconds. Run it with its matching driver version.
Make the next comparison answer your product question
If you are still choosing a module, first compare whether its interface and output fit the task. An analog output leaves the controller's ADC and voltage conversion in the path. An I2C output moves some work into the sensor and driver, but you still need to understand its mode, units and conversion settings.
For a meaningful bench comparison:
- keep the light source, position and orientation the same for every module;
- record settings and units with every result;
- compare like quantities against an appropriate reference instead of ranking the largest terminal number.
A lamp-response check and an outdoor UV Index check answer different questions, and none of our four runs is a head-to-head accuracy test.
Before putting the chosen module behind a cover, define the optical arrangement and repeat the relevant checks through it. Keep raw readings available while you develop the user-facing display, so you can tell whether a change came from the light, the settings, the conversion or the enclosure.