
You pause the program to investigate an intermittent fault, and the prototype restarts before you can inspect it. Or it appears stable while an engineer steps through the code, then restarts during normal use. In either case, ask how the watchdog behaves during that particular debugging session before treating the observation as evidence that the product is fixed, or broken.
A watchdog is a countdown that software must regularly renew. A debugger can deliberately stop software execution at a breakpoint. Whether the countdown also stops depends on the microcontroller and the firmware configuration. This matters when a small team hands a prototype from the development bench to people testing it without the development tools.
The issue is longstanding. In a March 2022 NXP Community discussion, a developer wanted to inspect a device before its watchdog reset it. The replies include the author's report that the watchdog was still active during debugging, and disabling it helped inspect the stopped program. That was a different microcontroller, not an RP2040 test, and not a reason to remove watchdog protection from a delivered product. The useful question is what changed between diagnosis and normal operation.
Check the firmware, not just the chip's feature list
The RP2040 hardware offers options to pause the watchdog under specific processor-debug and bus-access conditions. Those options make it possible to inspect a stopped processor without the watchdog immediately taking the session away. They do not establish how a particular application has configured the hardware.
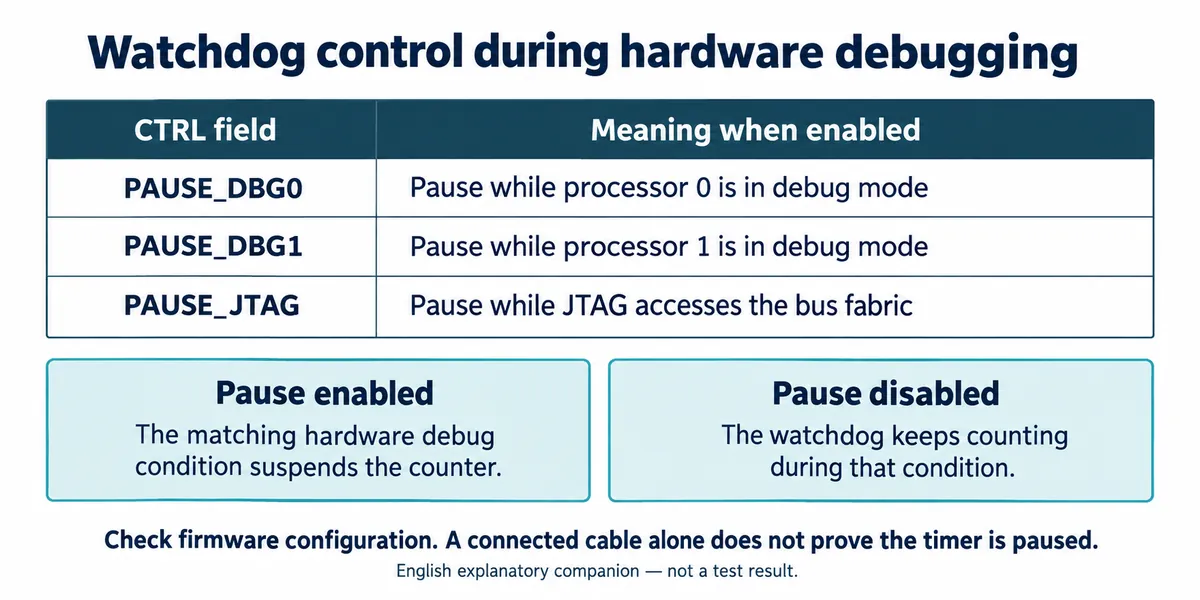
For example, Pico SDK 2.2.0 accepts a pause_on_debug choice when enabling the watchdog, and its implementation sets or clears the relevant pause bits. In contrast, the MicroPython 1.29 RP2 implementation calls watchdog_enable(timeout, false), which requests continued counting during those hardware debug conditions. Custom firmware or other versions need their own check.
Record the actual firmware and watchdog setup used in the session. "The debugger was connected" is not enough: a cable connection, a processor halted through hardware debugging, and a Python-level pause are different situations. Do not infer the hardware pause state from an editor's Pause button.
Separate finding the fault from testing recovery
During diagnosis, stopping execution is intentional. A suitable debug configuration can make it easier to inspect variables or follow a failing path. But once a watchdog has been paused, disabled or given a longer timeout for that purpose, the session no longer demonstrates the intended recovery behavior. Keep that change visible in the test record.
During a recovery check, the intended firmware must run with its intended watchdog configuration. If the application stops renewing the countdown, observe what the device actually does: whether it resets, how it starts again, and whether the user-facing function returns. That is a different question from whether a debugger can hold the program at one line for several minutes.
Keep the power arrangement and connected modules consistent where possible. If removing the debugger also changes the power source or wiring, you have changed more than the debugging condition. Compare one change at a time. A reboot alone does not prove a watchdog fault, and a successful step-through session does not prove normal timing works.
Leave enough evidence for the next person
The RP2040 watchdog has a reset-reason register whose REASON field distinguishes a timeout (TIMER) from a software-triggered watchdog reset (FORCE). Capture the reason at startup, before further resets obscure the sequence, together with the firmware version and what happened immediately beforehand. A reason flag identifies a mechanism; it does not identify the line of application code that stopped making progress.
For an intermittent exhibition controller, or a prototype being evaluated by another team, a short event record is more useful than a statement that it "sometimes crashes." Record:
- the last completed operation;
- whether execution was deliberately paused;
- the configured timeout;
- how long the device took to become usable again.
Choose a recording method that does not itself materially change the behavior being investigated.
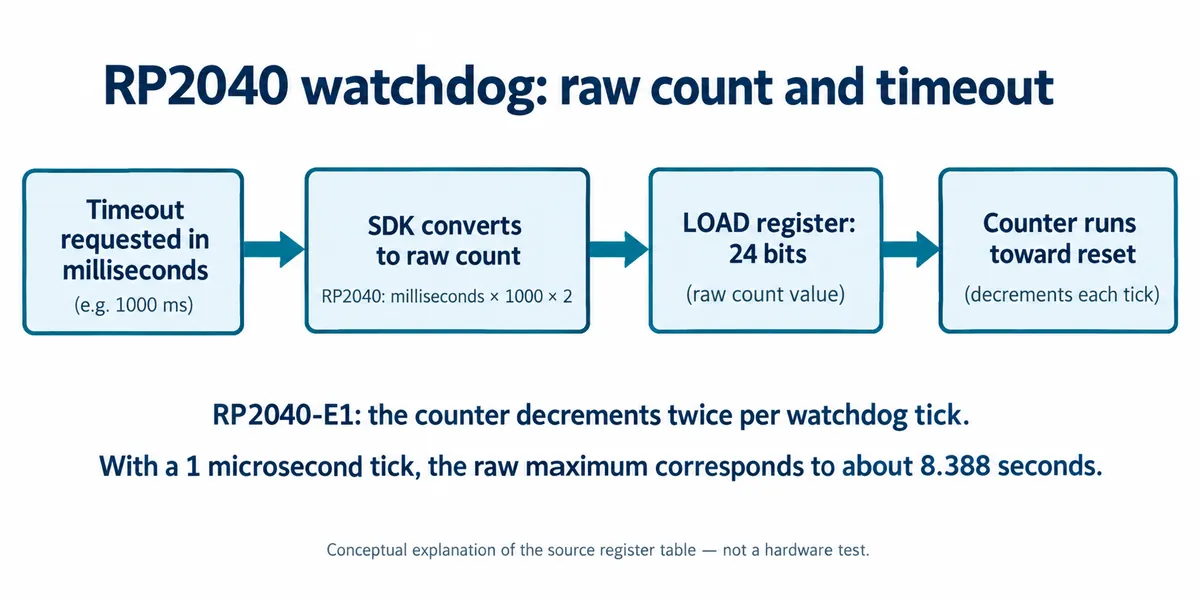
The register values also need interpretation. RP2040 erratum E1 makes the watchdog counter decrement twice per tick, so at a 1 microsecond tick the 24-bit raw maximum corresponds to about 8.388 seconds. The SDK handles the conversion from requested milliseconds; do not apply another factor of two to the high-level timeout, and do not copy a raw value from a register screenshot. This note gives no universal register-editing recipe and no measured timeout for your board.
Agree on the handover test
Before passing the prototype to users, ask for two clearly named records: how the fault was inspected, and how the intended standalone build behaved afterward. The second should exercise the real interaction and recovery path without an engineer repeatedly feeding or restarting it through development tools.
If the problem only appears in one setup, preserve that distinction rather than increasing the timeout until both look quiet. The remaining question may concern a blocking operation, another reset source or a timing dependency. The evidence above helps decide which explanation to pursue, without assuming that every difference between debug and standalone runs has the same cause. We have not run a debug-versus-standalone comparison for this note; these are the checks we would ask for.