
You have connected a particle sensor, and the terminal is printing PM2.5 readings. Now you want a small monitor for a studio, classroom or home. Before designing a neat front panel, decide where the sampled air will enter, where it will leave, and what the displayed number will actually mean.
On our bench we ran two Plantower sensors from a Raspberry Pi Pico (RP2040) with MicroPython: a PMS7003, and a board labeled PMS5003T through a GraftSense adapter. Both setups produced real serial output. Both stopped at the bench, so they establish the data path, not the performance of a finished enclosure.
This is a recurring question for builders. A DIY-monitor discussion on Reddit asks whether long runs of zero readings mean clean air or a problem, and the replies point toward the sensor batch, raw particle counts and calibration settings. Preserve the evidence behind a number before turning it into a colored indicator.
Start with the air, not the screen
These sensors draw air through a small optical chamber. A laser illuminates suspended particles, and the electronics turn the scattered light into particle counts and estimated mass concentrations. The fan and the sampling path are part of the measurement, not cooling accessories.
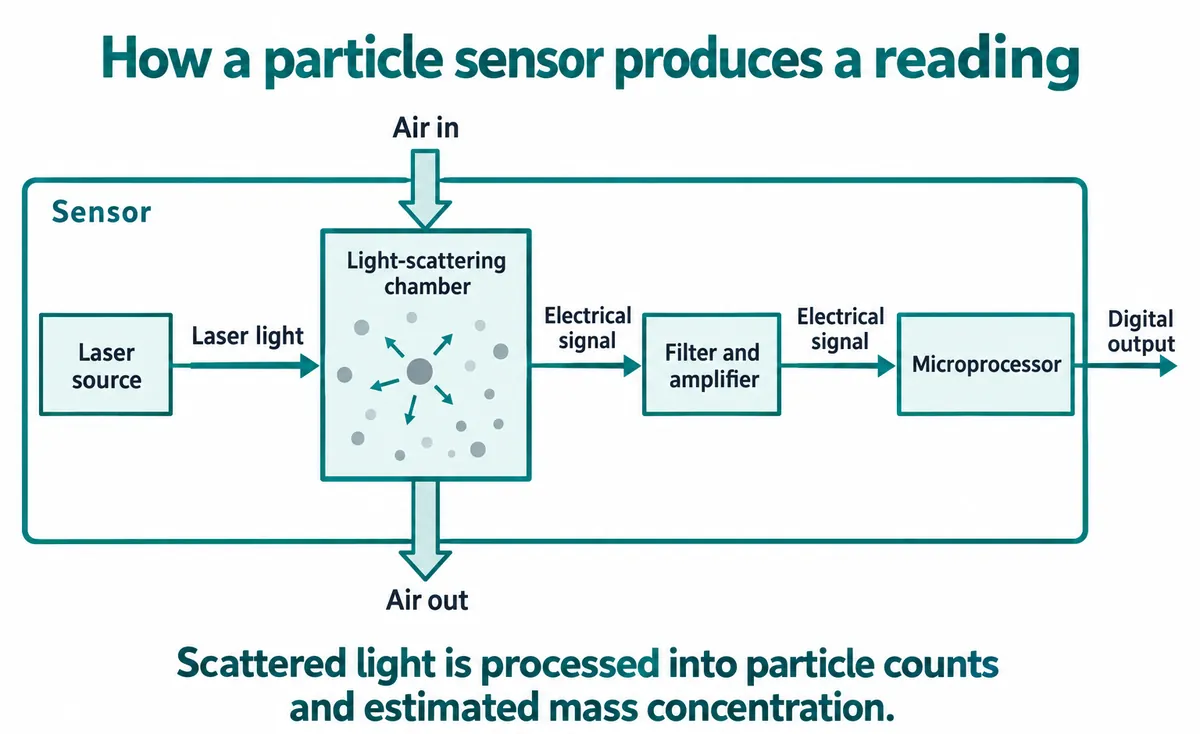
A tightly packed case can block the openings or let exhaust return straight to the inlet. In its PMS5003 installation guidance, Plantower recommends separating the inlet and outlet air paths, and calls for an unobstructed outlet area when the openings cannot sit directly against suitable external vents. If the monitor is part of an air purifier, the same guidance advises keeping the sensor out of the purifier's main air stream. Measuring inside a strong fan duct is a different arrangement from sampling room air.
That gives the mechanical prototype a clear job: expose the intended air sample without forcing it through an accidental loop inside the box. For one example of physical packaging, Our Air Quality's wall-mounted build points the openings downward and keeps the sensor ports clear of its mounting tie. The author also notes that protective mesh may change the response. Treat those as design choices to evaluate, not a weatherproofing guarantee.
Reproduce the electrical connection first
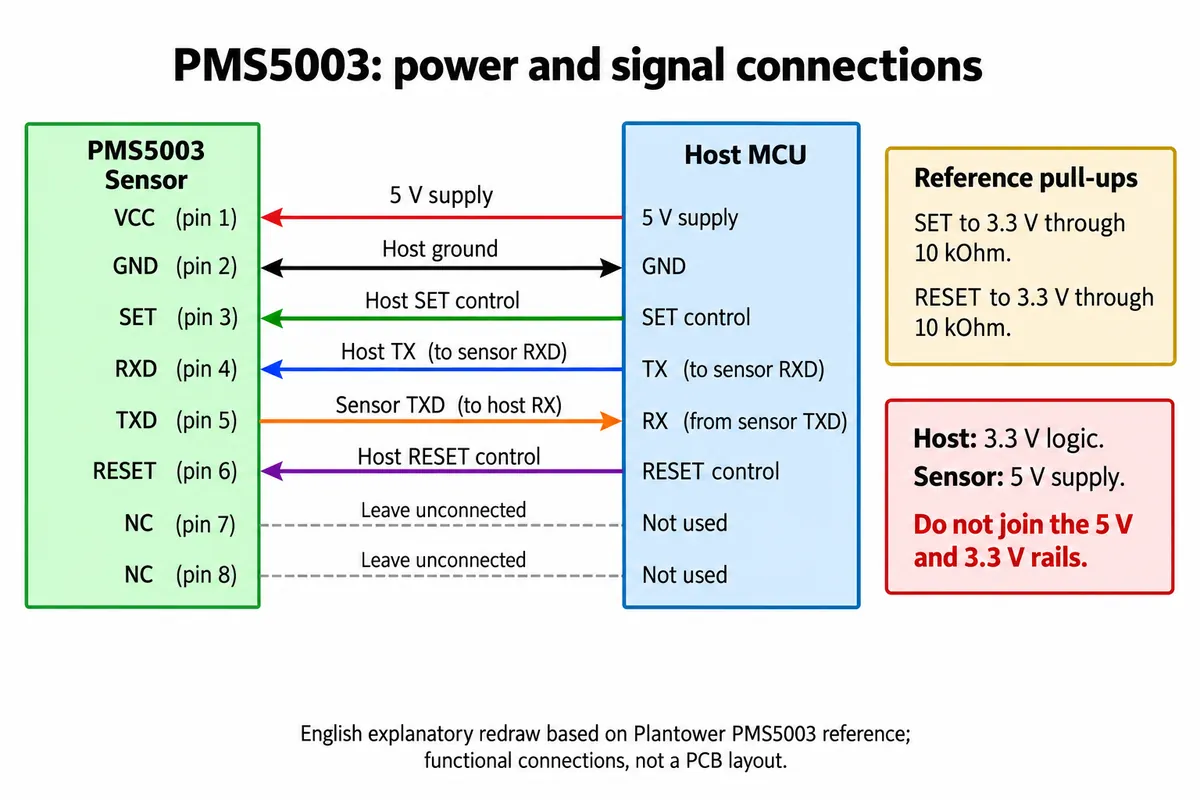
Both setups used UART0 with GP16 transmitting and GP17 receiving at 9600 baud. The adapter labels MTX and MRX refer to the host's transmit and receive paths. At the sensor, host TX goes to sensor RX, and sensor TX goes to host RX.
The sensor needs a 5 V supply while its serial and control signals use 3.3 V logic. A regulator on an adapter board does not mean every signal is level-shifted. Check the board schematic and your actual controller before replacing a known-good cable arrangement.
The PMS7003 has a different connector and a thinner outline (48 × 37 × 12 mm) than the PMS5003. That matters for cable clearance, mounting and spare parts. Do not pick a mating connector because two modules share a similar name.
Check the exact part, too. Our second board was labeled PMS5003T, but the manual and the driver we used both describe the plain PMS5003, without temperature or humidity handling. Confirm the label and the matching protocol before adding those fields to a product specification.
Keep one simple continuous-reading baseline
For the PMS7003, our program opened UART0, waited 30 seconds and then read repeatedly, selecting the atmospheric-environment PM2.5 and PM10 fields rather than the standard-particle fields. That is a starting point, not a fault-tolerant application. Keep a continuous-reading baseline like this while you check wiring, frame integrity and the display, and add sleep behavior only once the baseline is understood.
The PMS7003 terminal showed PM2.5 around 112 to 115 µg/m³ and a separately calculated AQI. We had no reference instrument and no controlled aerosol condition. The useful result is that the setup receives and presents data, not that those concentrations are validated.
Treat sleep as a measurement-state change
The second setup used an asynchronous PMS5003 driver that credits Kevin Köck's pms5003_micropython project (MIT). The program started in passive mode with a 60-second interval, switched to active mode, tried a 20-second passive interval without the economy setting, and finally enabled the economy setting again. Its terminal showed an environmental PM2.5 field of 75 µg/m³. Identify fields from the raw frame and the protocol rather than copying printed labels into a user interface.
Passive mode means the host requests a reading. It does not by itself mean the sensor is asleep. When sleep stops the fan, the next wake-up has to let the sample flow stabilize: the PMS5003 manual specifies at least 30 seconds after wake-up, and the driver we used waits 40 seconds.
A monitor should distinguish "warming up," "new reading," "last reading" and "sensor unavailable." Otherwise a frozen or sleeping sensor looks like a stable room. Timestamp the data you keep, and test a disconnect as well as a successful read before relying on an unattended display.
Decide which number belongs on the display
The protocol carries standard-particle and atmospheric-environment mass estimates alongside particle counts. Keep their names and units distinct. A count per 0.1 liter is not a mass concentration in µg/m³, and an AQI is a further calculation, not a field the sensor supplies.
If you display an AQI, check which PM2.5 breakpoints your code uses and whether it applies them to each instantaneous reading. A current U.S. AQI needs the breakpoints and averaging method in the AirNow technical guidance. For a first prototype, clearly labeled raw concentration trends are easier to inspect than an unexplained health category.
AirGradient's batch-correction documentation shows why a correction coefficient should travel with its sensor and processing context. Its corrections are not universal constants for any Plantower project, and it distinguishes DIY kits from devices that already use factory calibration. Plantower's own consistency curves, measured at different temperatures and after continuous operation, describe their tests, not your enclosure.
Make the enclosure test answer one practical question
Use the same sensor, firmware, operating mode and placement to compare the open assembly with the proposed enclosure. Keep the inlet and outlet clear, record the raw fields with timestamps, and compare both the level and the response to normal changes in the room. Do not adjust calibration just to make two unrelated displays agree.
If the enclosed unit responds differently, first look at blocked vents, recirculation, fan operation and warm-up. If readings differ between units, record the exact sensor labels and batch information before investigating calibration. What air reaches the sensor, and how its data is interpreted, are two questions that need separate evidence.
The next useful milestone is a case with a documented air path and an open-versus-enclosed log, not a more polished screen.