
Your prototype works on USB power. Now it needs to fit in a handheld case and run through a workshop, an exhibition or a day of testing. It is tempting to choose a battery from the processor's headline power figure, but the screen, sensors, regulator and software all change what the complete device consumes.
A useful first step is to put a current monitor in the power path and watch a known load. On our bench we did that with a GraftSense INA219 module, a GraftPort-RP2040 board running MicroPython, a bench supply and an electronic load. That establishes steady operating measurements; short bursts, sleep current and realistic runtime are the tests that come after it.
Know which part of the product you are measuring
A current monitor measures what passes through its sensing resistor. Put it before a regulator and you see the regulator's input; put it after and you see a different voltage and current. If the controller is still powered from a separate USB cable, its consumption may be outside your measurement entirely.
This trips up real battery projects. In an April 2021 Arduino discussion, a developer could see active consumption but struggled with brief wireless activity and a much smaller sleep current. The useful question is not "does the meter show a number?" but "does this setup see the operating states that decide my runtime?"
For the first test, keep the load simple and adjustable. An electronic load draws a set current, so you can change the test condition without also debugging a whole product. Once the readings make sense, substitute your prototype and note which power paths are still outside the measurement.
Put the sensing resistor in series with the load
The module has two screw terminals. Supply positive goes to IN+, and IN− continues to the load's positive input. The load's negative returns to supply negative. These terminals are not a voltmeter input to place across a supply; they are the two ends of a low-value resistor in the load's current path.
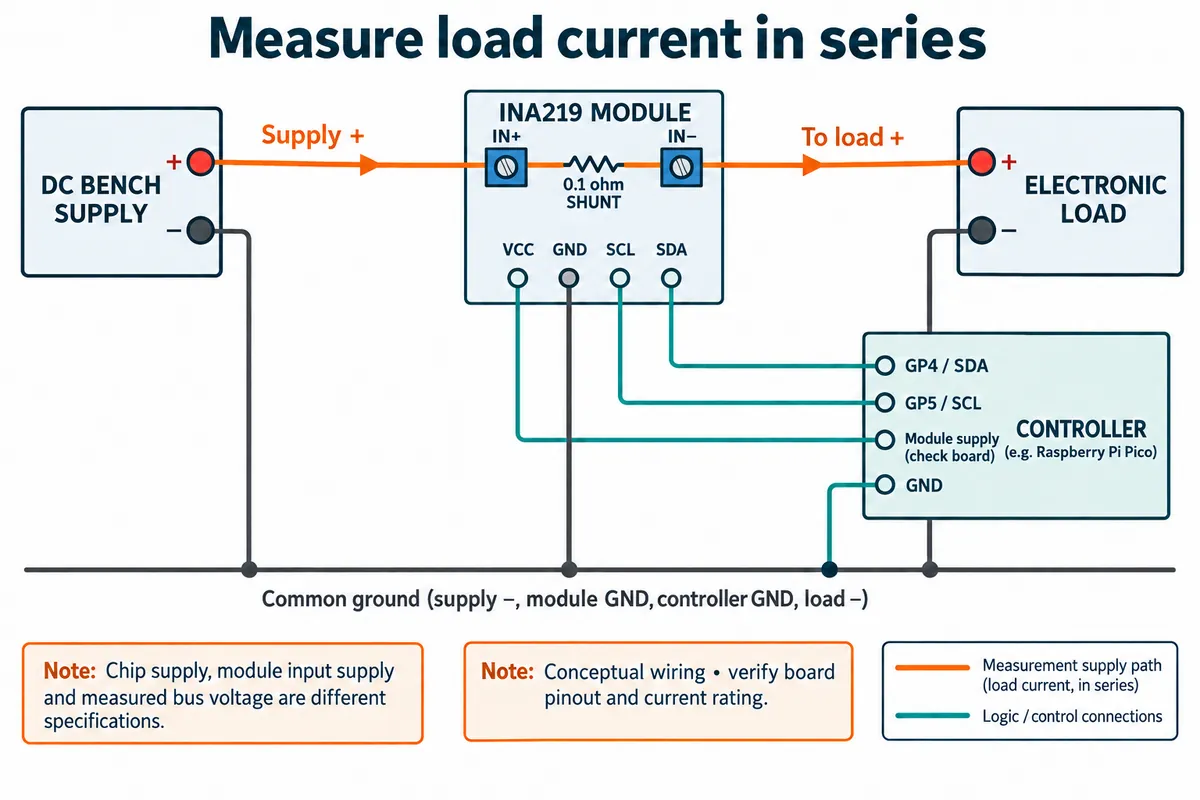
The host connection used I2C0, GP4 for SDA and GP5 for SCL. Treat the module's own power separately from the measured load voltage: its schematic shows a 5 V input feeding a 3.3 V regulator, with I2C pull-ups to 3.3 V. That is no reason to put the measured supply voltage on the controller's power pin.
The sensing resistor is 0.1 Ω. At 1 A, Ohm's law gives a 0.1 V drop and 0.1 W of heating in the resistor. Those are calculated examples, not measurements. A larger resistor makes small currents easier to see but disturbs the load more; that trade-off is the main design choice for any current-sense circuit.
Configure the driver for the resistor actually fitted
We installed an INA219 driver package (version 1.0.0). Our program scanned for address 0x40 and stopped if the device was missing. Seeing that address confirms communication, not measurement accuracy.
The key settings were a 0.1 Ω shunt, a 2 A expected maximum current, the 16 V bus range, and 12-bit conversions for bus and shunt. The program enabled continuous measurement and wrote calibration values before reading current and power.
"Calibration" here tells the chip how to turn the voltage across the resistor into scaled current and power. It does not mean the assembled instrument was compared with a traceable reference. If another module carries a different shunt, copying the same software value gives plausible-looking but wrong results.
Two specifications are easy to misread. The registers are 16 bits wide, but the conversions shown here run from 9 to 12 bits with averaging options; this is not a 16-bit ADC. And the selectable "32 V" register scale does not permit 32 V on the inputs: TI specifies a 26 V maximum bus voltage. Board components and transients still need their own checks.
Read the recorded result without overstating it
The program printed bus voltage, shunt voltage, current and power about once a second. A code comment called the interval seconds, but the value 1000 was compared with ticks_ms(), so it is in milliseconds. While it ran, we adjusted the supply and load.
The log ran from roughly 0.894 to 1.317 A, while the reported bus voltage fell from about 4.524 V to 4.436 V and power rose from about 4.04 W to 5.85 W. The load's own display showed about 4.901 V and 1.001 A at one point, with the supply set near 5 V and 1 A. These are useful records of the setup, but they were not captured at the same instants, so they are not evidence that the monitor matches the instruments at every point.
The INA219 measures bus voltage at IN− relative to ground, on the load side of the shunt. The supply terminal voltage can differ because of the shunt, cables and connections. For a meaningful comparison, hold one load setting, measure the same nodes with a reference meter, and record both together. A discrepancy is a reason to check the measurement path, not automatic proof that the battery or sensor is faulty.
A slow display is not a complete power profile
One reading per second helps compare steady operating modes. It cannot show the peak current during a short radio transmission, motor start or display refresh. The chip's conversion process and the program's logging interval are separate limits, and removing a print delay does not guarantee every peak is captured.
The driver also reported 532 µs as its wait time for this configuration, taking the larger of the bus and shunt conversion times. The chip measures the two in sequence, so that is not the full time for a fresh pair. For faster profiling, coordinate conversion-ready status, timestamps and logging with the actual configuration before reading anything into the trace.
Small sleep currents need a separate check. With a 0.1 Ω shunt, 100 µA produces only 10 µV across the resistor, so offset, noise and the selected range dominate. A zero or slightly negative reading does not prove a sleeping device draws nothing. Layout matters too: Kelvin connections that keep the sensing traces separate from the high-current path help on a custom board.
Turn measurements into a battery decision
For a first battery decision, record how long the prototype spends starting up, working, waiting and sleeping. Combine representative currents with those durations, then test the candidate battery under the actual duty cycle. If the battery feeds a converter, measure on the battery side or account for conversion losses; current on a 5 V rail is not directly comparable to a battery's capacity rating at another voltage.
The next useful deliverable is a short power budget with a clear measurement boundary and its remaining uncertainties. It tells the team whether to cut idle consumption, change an always-on peripheral, or leave more room for the battery before the enclosure dimensions are fixed. Our bench test is a starting point for that decision, not a runtime claim.