
Your room monitor has reached an encouraging stage: the sensor responds, numbers scroll past, and you are ready to put them on a screen. Before choosing the font or adding a green status light, settle one question: what will a person think those numbers mean?
A display labeled "CO₂" suggests a carbon-dioxide measurement. A raw gas-sensor value is something different, and an estimated CO₂ value needs that qualification. This matters once a prototype moves from showing a graph to suggesting an action. A Home Assistant builder discussing a DIY room monitor wanted readings to control a fan. The label is part of the engineering decision, not just the visual design.
On our bench we connected three metal-oxide gas sensor modules, an SGP40, a CCS811 and an ENS160, to a GraftPort-RP2040 controller and read their output in MicroPython. Each run showed something different about what belongs on a prototype screen.
Start with the question the monitor should answer
"Has the gas-sensor response changed?" and "What is the room's CO₂ concentration?" need different evidence. These sensors can help explore changes in indoor air, but our runs did not establish pollutant-specific measurements or validate ventilation control.
| Sensor | What our program produced | A useful prototype label |
|---|---|---|
| SGP40 | Raw VOC signal in ticks | Raw VOC signal, engineering view |
| CCS811 | Algorithm-derived eCO₂ and TVOC | Estimated CO₂ / TVOC, with readiness state |
| ENS160 | Algorithm-derived eCO₂, TVOC and an air-quality index | Named sensor index / estimated values, with validity state |
If the product's main question is actual CO₂ concentration, choose a sensor designed for that measurement. If you are exploring a gas-response indicator, these modules help you build and inspect the data path. Both can live in one product, but they should not share a misleading label.
SGP40: get an honest raw reading
The SGP40 ran on GP4 (SDA) and GP5 (SCL) with a 100 kHz software I2C bus. The program scanned for address 0x59, read the serial number and ran the built-in self-test before its measurement loop. Keep the driver version with the test record so someone else can reproduce the setup.
The central call was measure_raw_signal(rel_hum=50, temp=25) once per second. Those temperature and humidity values are fixed inputs, not measurements of the room. The output showed a self-test result of 0xD400, an initial raw zero and then values around 26,000 ticks.
That is a useful communication check. It is not 26,000 ppm, and it is not a VOC Index. Sensirion's Gas Index Algorithm processes the raw signal on the host to produce an index, and the sampling interval must match the algorithm configuration (one second by default). Our test did not include that stage.
There is also a concrete bug to fix before extending the driver we used. Its humidity conversion multiplies by 65.35; the SGP40 datasheet specifies 65535 × RH / 100. At 50% RH those give roughly 3,268 and 32,768 ticks. So the fixed inputs we printed do not establish correct compensation. Correct the conversion, check the transmitted bytes and repeat the test before the result feeds a user-facing indicator.
For a first screen, keep raw output in an engineering view. Add a properly implemented VOC Index and its readiness behavior when you want a relative indicator a user can interpret. An ESPHome question about SGP40 "ppm" shows how easily the distinction gets lost; printing a different unit beside a number does not make it a concentration.
CCS811: read it, then watch what happens after reset
The CCS811 used the same pins at 100 kHz; its carrier adds an address selector and a reset connection. The program printed application and error status and the baseline, selected one-second measurement mode, read eCO₂ and TVOC five times, then performed a software reset and read again.
The readings showed eCO₂ of 400 to 421 ppm and TVOC of 0 to 5 ppb. After the reset, the final line read eCO2: 0 ppm and TVOC: None. Neither should become a reassuring "clean air" result on a product screen. None is a missing value, and a zero right after a reset is not evidence that the room has no CO₂.
The CCS811 datasheet describes a conditioning period after starting a measurement mode, including a 20-minute run-in after an idle period, and distinguishes early-life changes from routine operation. A few successful I2C reads do not show those steps are complete.
Two software checks before reproducing this: our example passed an addr argument that the driver version's constructor did not accept, so match versions first. And the driver checks data availability separately for its two read methods, so read related values as one coherent sample and handle "no new data" explicitly.
During startup, the screen can still help. Show "Preparing sensor" or "Waiting for a reading" and keep diagnostics available to the developer. Once ready, keep the word estimated beside eCO₂.
ENS160: use the status as well as the numbers
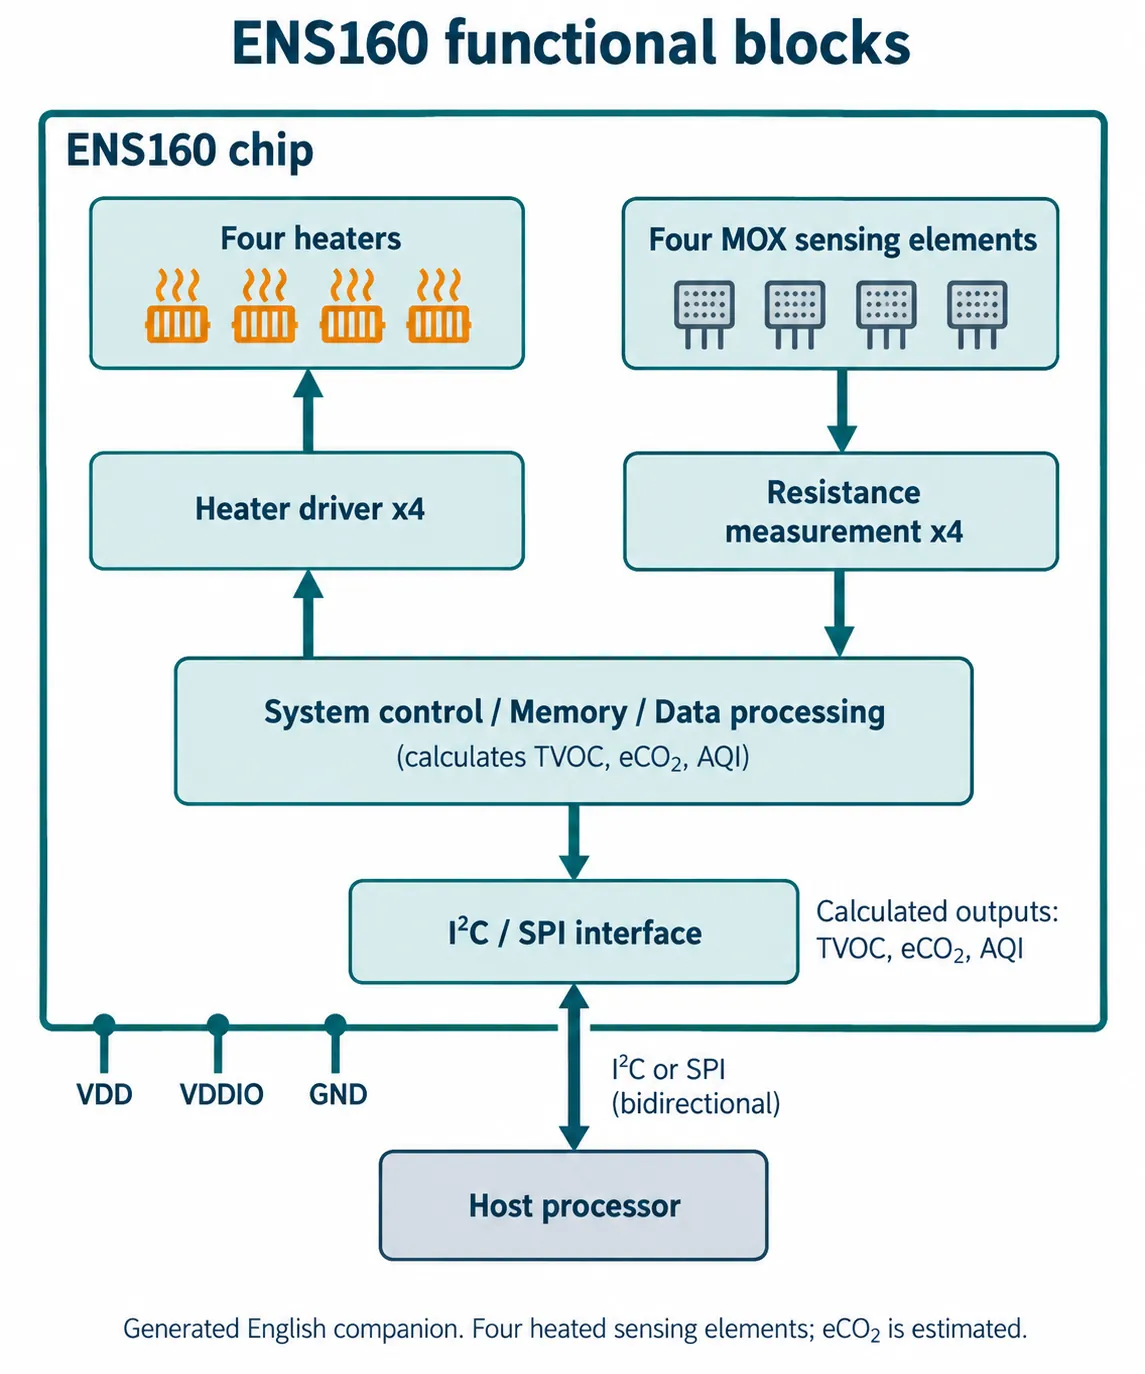
The ENS160 ran on GP4/GP5 with a 400 kHz software I2C bus. The program scanned for 0x52 or 0x53, read identification and status, started standard operation and requested a result about once per second.
The module and the bare chip differ: the carrier handles the surrounding circuitry, while the chip has separate VDD and VDDIO supplies. Do not take the module's supply as permission to connect a bare ENS160 to it. When checking communication, use the seven-bit address MicroPython expects, 0x52 or 0x53. The 0xA4 and 0xA6 values that appear in some descriptions are write bytes that already include the read/write bit; mixing the formats can make a correctly wired sensor look absent.
The output printed eCO₂, TVOC and AQI together, with changing values including eCO₂ readings of 400 and 505. But the startup status was 0x8A, which decodes to validity_flag=2: initial startup.
The ENS160 datasheet, version 1.3 defines separate states for normal operation, warm-up, initial startup and invalid output. It describes a first-start period of up to an hour and a warm-up after later power-ons. Startup history is not stored immediately, so repeated early power cycling can restart initial conditioning.
Our example checked for new data but did not use validity to decide what to show, and we did not log the status beside every later sample. So the changing numbers alone do not demonstrate valid operation. In a product, check error, validity and freshness before presenting a result as current. This is the display policy we would use, written as pseudocode rather than a tested driver:
read sensor status
if communication failed or the sensor reports an error:
    show "Sensor unavailable"
else if sensor is starting or warming up:
    show "Preparing sensor"
else if output is invalid:
    show "Reading unavailable"
else if a fresh sample is available:
    read related values together
    update the display with explicit labels and a timestamp
else:
    keep the last sample's timestamp; do not present it as new
Turn the bench run into a usable monitor
These runs cover different pieces of one path: wiring, identification, reading and interpretation. The next prototype should combine them with the intended display and enclosure. Record startup time, disconnection behavior and what happens after power returns. Check that a person can tell a valid current reading from an old one without opening a serial terminal.
Feed measured temperature and humidity where a sensor's compensation needs them. The fixed values in our SGP40 run and the unused environmental inputs in our ENS160 run do not establish compensation inside a finished enclosure. Keep the sensor's air exposure consistent enough that you can explain a change before designing an alert around it.
For user testing, ask people what they would do after seeing each screen state. If "estimated CO₂" is repeatedly read as a direct measurement, simplify the display or reconsider the sensing approach. If a startup screen looks like a fault, explain that the sensor is preparing. These are product decisions you can test before ordering a batch of boards.